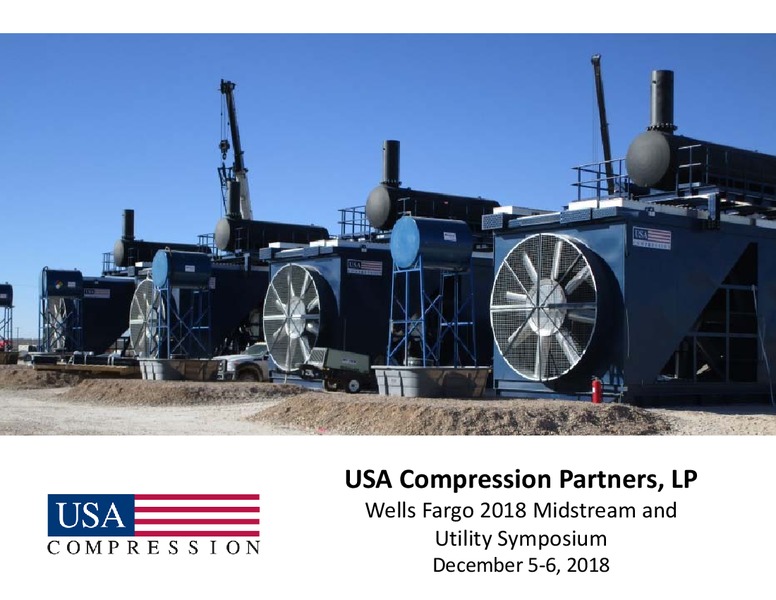
USA Compression Partners, LP Wells Fargo 2018 Midstream and Utility Symposium December 56, 2018
Q3 2018 Recap Attractive Marketplace; Solid Quarter; Continued Integration Q3 2018 fleet HP of 3.6 million / average revenue generating HP of 3.2 million Average active HP up 75,000 over Q2 Operational Average horsepower utilization…
Macro Overview & Demand Drivers
Domestic Natural Gas Supply & Demand Growth Natural Gas Supply & Demand Continues to Grow as does the need for midstream infrastructure to move it through the pipeline system EIA projects significant increase in natural gas demand…
Macro Thesis: The Shift to Shale Shale Gas Expected to be the Primary Source in Future Shale Ramp: Production from shale has now pulled Shale gas is typically produced at lower wellhead even with all other sources pressures (050…
Key Industry Drivers for Compression Services Compression is Critical Midstream Infrastructure for Producing & Transporting Hydrocarbons 85% of USACs business (by HP) is installed in natural gasbased infrastructure applications Overall…
Customer Activity E&P Activity Benefitting from Efficiencies; Compression Demand Follows Growth in drilling activity has moderated Producers continue to be active in attractive areas, but takeaway bottlenecks are having an impact…
USAC Overview
USAC Overview Large Horsepower Strategy at Core of USAC Business Business Overview USAC Market Statistics Geographically diversified provider of compression ( in billions) services LP Equity Value 1.4 billion Focused primarily on…
Geographic Presence CDM Acquisition Expanded Geographic Footprint Northeast MidCon Region 23% Region (OK) 17% Permian Southeast Region 29% Region (ArkLa, Rockies, NE Texas) 15% Gulf Coast Region (LA, TX Coast,…
Organizational Chart Energy Transfer Combined, the Energy Family Transfer family owns 48% of USAC Public Unitholders USA Compression GP, LLC (our general partner) 52.2% 39.5% LP LP Nonecon Preferred GP;…
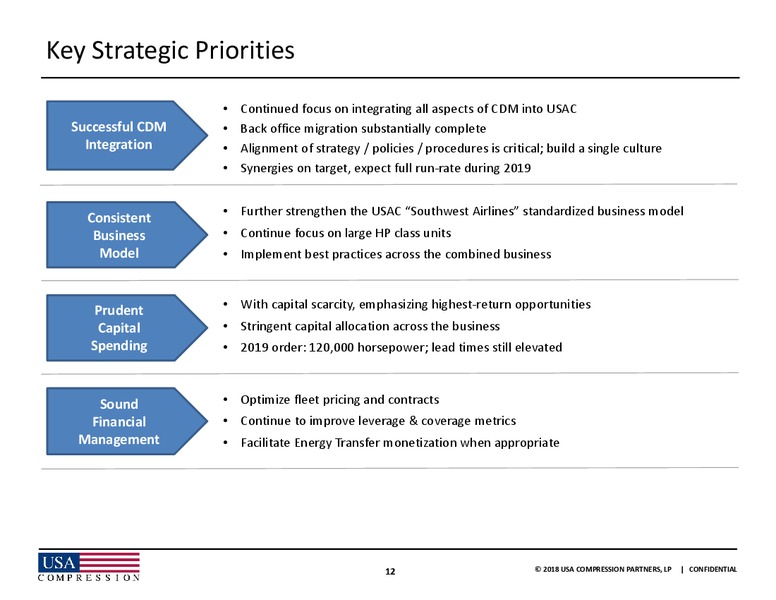
Key Strategic Priorities Continued focus on integrating all aspects of CDM into USAC Successful CDM Back office migration substantially complete Integration Alignment of strategy / policies / procedures is critical; build a single…
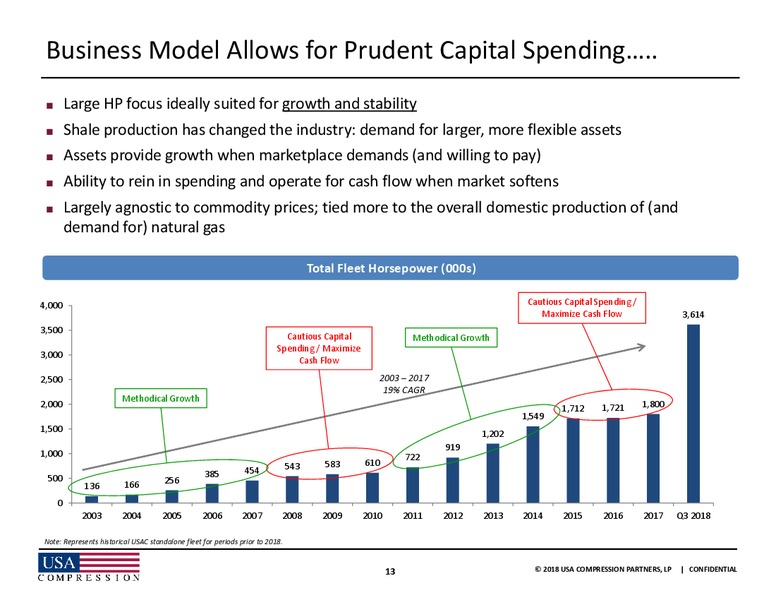
Business Model Allows for Prudent Capital Spending.. Large HP focus ideally suited for growth and stability Shale production has changed the industry: demand for larger, more flexible assets Assets provide growth when marketplace…
..Leading to Cash Flow and Asset Stability Through Cycles Utilization, which was impacted by lower CDM fleet utilization, Horsepower Utilization has now returned to higher levels HH Nat Gas /MMBTU 100.0% 14 90.0% 12…
USAC Customer Overview Top 20 Customers: Diverse Counterparties & LongTerm Relationships % of Length of Total % of Length of Total Customer Rev(1) relationship HP Customer Rev(1) relationship HP Independent Public E&P 8% 17 Years…
Large Horsepower Gas Applications Drives Stability Compression Unit Size Matters USAC Focus: Gas Compression Industry: Key Characteristics by Size Small Medium Large Ex. Large XX Large Commentary Compression More 400 1,000 1,500…
Balancing Distribution Stability and Leverage Annualized Distributions per Common Unit Stability in Distribution through the cycle USAC Historical Leverage(1) Note: Reflects USAC standalone for all periods prior to April 1,…
USAC Standalone Operational and Financial Performance Avg. Revenue Generating HP (000s) Revenue (MM) mm HP 500 2007 2017 3,500 3,212 2007 2017 15% CAGR 412 3,000 15% CAGR 400 2,500 280 300 271 266 2,000 222 1,409 1,378 1,506…
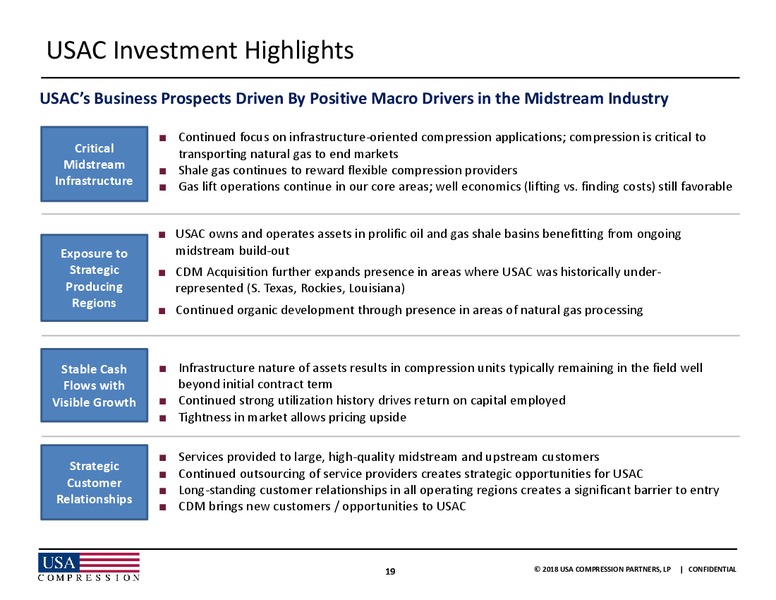
USAC Investment Highlights USACs Business Prospects Driven By Positive Macro Drivers in the Midstream Industry Continued focus on infrastructureoriented compression applications; compression is critical to Critical transporting…
Appendix
Compression Throughout the Value Chain Midstream Compression Offers Cash Flow & Customer Stability Lower (Sm. Volumes) Pressure Regime Higher (Lg. Volumes) Crude Oil Wells RateBase Applications Gas Lift Midstream Applications…
NonGAAP Reconciliations Three m onths ended Septem ber 30, June 30, March 30, 2018 2018 2018 Net income (loss) (563) 3,197 (23,370) Interest expense, net 25,443 25,682 - Depreciation and amortization 59,403 52,868 44,672 Income…
NonGAAP Reconciliations, contd. Years Ended December 31, ( in 000's) 2017 2016 2015 2014 2013 2012 2011 2010 2009 2008 2007 Net income (loss) 11,440 12,935 (154,273) 24,946 11,071 4,503 69 10,479 21,228 20,911 7,122 Interest expense,…
NonGAAP Reconciliations, contd. Three m onths ended Septem ber 30, June 30, March 30, 2018 2018 2018 Net income (loss) (563) 3,197 (23,370) Plus: Non-cash interest expense 1,516 2,039 - Plus: Non-cash income tax expense (benefit)…
NonGAAP Reconciliations, contd. Guidance Net loss (18.0) million to (8.0) million Plus: Interest expense, net 78.3 million Plus: Depreciation and amortization 216.3 million Plus: Income tax expense (1.6) million EBITDA 275.0…
 Loading...