Agenda Highlights Financial results Business & Operations Outlook Summary 3
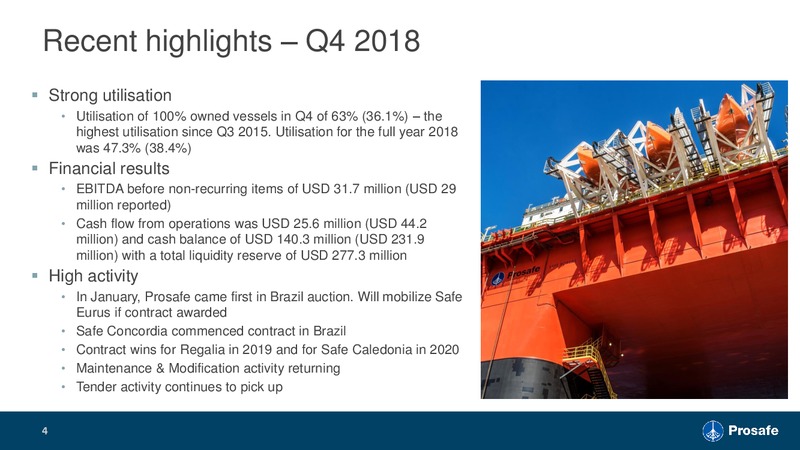
Recent highlights Q4 2018 Strong utilisation Utilisation of 100% owned vessels in Q4 of 63% (36.1%) the highest utilisation since Q3 2015. Utilisation for the full year 2018 was 47.3% (38.4%) Financial results EBITDA before…
Agenda Highlights Financial results Business & Operations Outlook Summary 5
Income statement Highest quarterly fleet utilisation since Q3 2015 at (Unaudited figures in USD million) Q4 18 Q4 17 63% (Q4 2017: 36.1%). Operating revenues 74 77 Lower operating revenues despite higher utilisation Operating…
Balance sheet (Unaudited figures in USD million) 31.12.18 30.09.18 31.12.17 Vessels 1,423 1,451 1,527 Total assets of ca. USD 1.7 billion New builds 126 126 125 Other non-current assets 10 16 11 Reduced cash balance due to repayment of…
Agenda Highlights Financial results Business & Operations Outlook Summary 8
Prosafe - Transformed and repositioned o Add three versatile units with global reach 1 Modernized the fleet o 50% of the fleet will be less than 4 years old o Safe Astoria scrapped 6th vessel scrapped since 2016 o Limited debt…
Fleet status: Contracts, wins and extensions Contract backlog Contracting update Fixtures Q4 2018 Safe Caledonia 80 days firm award with a 30-day option with a major oil and gas operator, UKCS. Ability to substitute the vessel…
Agenda Highlights Financial results Business & Operations Outlook Summary 11
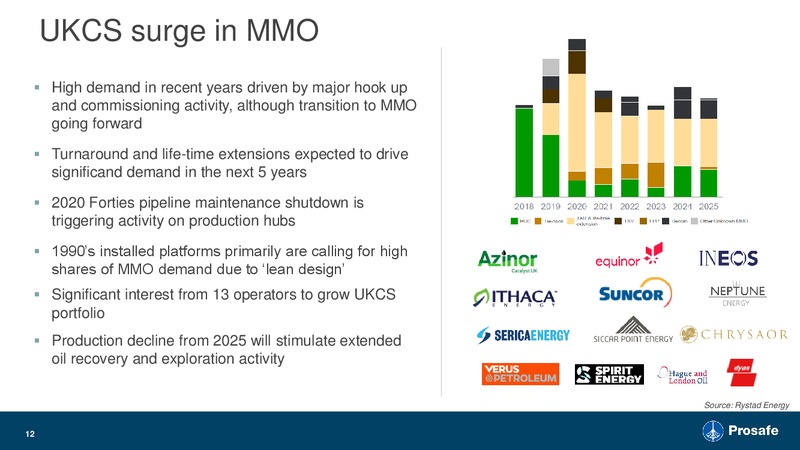
UKCS surge in MMO High demand in recent years driven by major hook up and commissioning activity, although transition to MMO going forward Turnaround and life-time extensions expected to drive significand demand in the next 5…
Norwegian Shelf positive activity indications Anticipated demand driven primarily by maintenance requirements linked to lifetime extension Entrance of new operators like in the UK could be a positive factor supporting this type of…
Key Brazil developments IOC offshore spending increase Prosafe came first in Brazil auction. Will mobilize Safe Eurus if contract awarded Even upon conclusion of the tenders, contracted supply considered insufficient to meet…
Indicative re Prosafes newbuild COSCO units * - Very competitive cash break-even Comment Cash break even cost per day Illustration shows minimum cash cost 100 000 elements with COSCO financing 90 000 package (assuming indicative…
Mexico Indicators pointing to activity growth from 2020 Average age of offshore facilities in Mexico is over 25 years Offshore facilities by installation year Over 50% of infrastructure weight was installed prior to 1991 (topside…
Tender activity significantly increased in 2018 Number of contracts Contract months Comments Awards in 2018 offer activity rebound in to 2019: In 2018 Prosafe saw more than a doubling in the number of new contract awards 50% of…
Order backlog Prosafes firm backlog was USD 209 Order Backlog (USD million) million per end Q4 2018 Awarded 41% and 76%, respectively, 1400 of global and North Sea contracts bid 1200 593 for last 6 years 1000 564 518 800…
Prospects & tendering 3 year lookout Global opportunities Tendering activity 3 year profile 13 tenders ongoing for 2019 through 2021 12 tenders with commencement dates in 2019 21 North Sea prospects with high probability of going…
Agenda Highlights Financial results Business & Operations Outlook Summary 20
Summary Highest quarterly utilisation since Q3 2015 High activity Maintenance & Modification activity returning Prosafe came first in Brazil auction. Will mobilize Safe Eurus if contract awarded Safe Concordia commenced contract in…
Appendix 22
Operating revenue (USD million) Q4 18 Q3 18 Q4 17 12M 18 12M 17 2017 Charter income 59.3 54.5 70.6 260.6 256.1 256.1 Other income (incl amortization of fees) 14.8 19.1 6.1 70.2 26.9 26.9 Total 74.1 73.6 76.7 330.8 283.0…
 Loading...