Year-End and Fourth Quarter 2018 Earnings Release February 26, 2019 NYSE: MTDR
Selected Operating and Financial Results Three Months Ended Year Ended December 31, September 30, December 31, December 31, December 31, December 31, 2018 2018 2017 2018 2017 2016 (1) Net Production Volumes: Oil (MBbl) 3,080 2,973…
Headlines and Highlights for Year-End and Fourth Quarter 2018 Oil and total production were record numbers in Q4 2018 and up more than expected from Q3 2018 Oil production of 33,500 Bbl per day, up 4% from 32,300 Bbl per day in Q3 2018…
Q4 2018 Volumes At Record Levels Driven by Strong Delaware Production Average Daily Oil Production Average Daily Total Production (Bbl/d) (BOE/d) Oil up 4% sequentially; up 36% YoY BOE up 2% sequentially; up 27% YoY 55,536…
Committed to Maintaining Strong Balance Sheet Through the Cycles Preserved and enhanced liquidity through addition of San Mateo credit facility in December 2018, October 2018 Senior Notes tack-on offering, August 2018 Senior Notes…
Matadors Proved Reserves 215 Million BOE at December 31, 2018(1) Reserves and Oil Production Doubled Over Last Two Years Haynesville/CV Haynesville/CV Haynesville/CV 11.4 MMBOE, 8% 11.7 MMBOE, 5% 13.1 MMBOE, 12% Eagle Ford Eagle…
Consistent Proved Reserves per Share Growth Matadors reserves per share are at all-time highs despite a 45% decrease in crude oil prices since mid-2014 Since Matadors IPO, reserves per share have increased 3.7x Oil Reserves per…
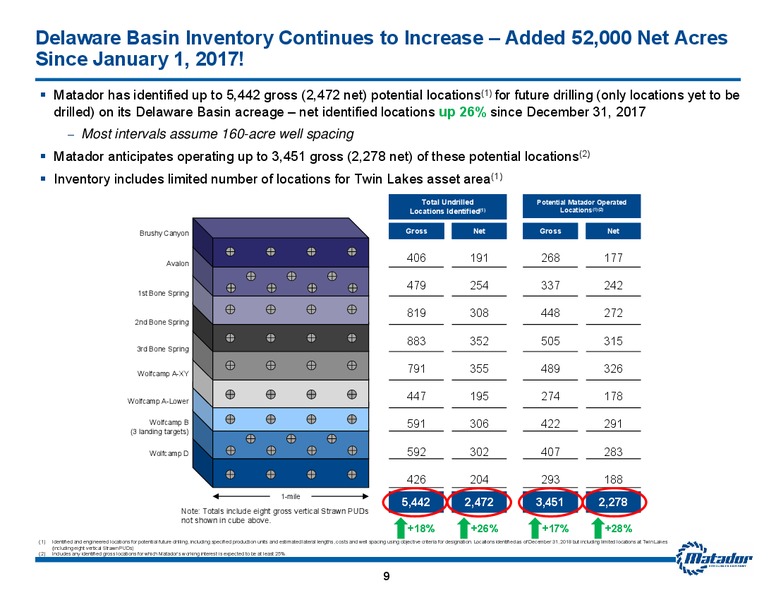
Delaware Basin Inventory Continues to Increase Added 52,000 Net Acres Since January 1, 2017 Matador has identified up to 5,442 gross (2,472 net) potential locations(1) for future drilling (only locations yet to be drilled) on its…
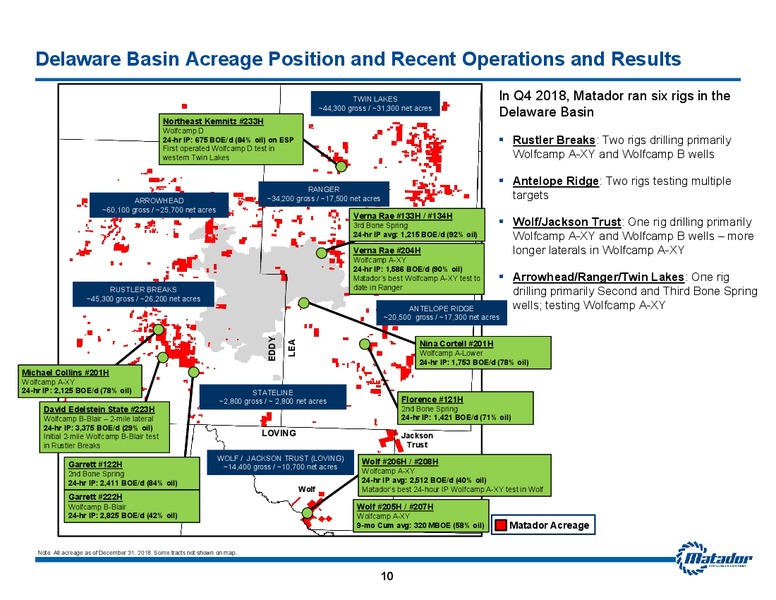
Delaware Basin Acreage Position and Recent Operations and Results TWIN LAKES In Q4 2018, Matador ran six rigs in the 44,300 gross / 31,300 net acres Delaware Basin Northeast Kemnitz 233H Wolfcamp D 24-hr IP: 675 BOE/d (84% oil) on…
South Texas Asset Area Q4 2018 to Q1 2019 Drilling Program Drilled nine wells in South Texas in Q4 2018 and early 2019 Drilled eight Eagle Ford wells and one Austin Chalk test; seven of nine wells have lateral lengths between 7,800 and…
Wells Completed and Turned to Sales Q4 2018 During the fourth quarter of 2018, the Delaware Basin accounted for 43 gross (21.6 net) wells completed and turned to sales, including 22 gross (19.2 net) operated and 21 gross (2.4 net)…
Significant Growth in Delaware Midstream Business in Last Three Years Q4 2016 Q4 2017 Q4 2018 Growth(1) Designed Water Disposal 70,000 Bbl/d 160,000 Bbl/d 220,000 Bbl/d 3.2x Capacity Average Water Disposed 49,000 Bbl/d 83,000…
San Mateo Highlights and Update February 2019 Matador entered into second strategic midstream transaction with Five Point Energy LLC to expand San Mateos operations in the Delaware Basin see February 25, 2019 press release February…
Amended Revolving Credit Facility in October 2018 Strong, supportive bank group led by Royal Bank of Canada Amended Credit Agreement increased facility size to 1.5 billion (from 500 million); maturity extended to October 2023…
New San Mateo Credit Facility Closed in December 2018 Led by The Bank of Nova Scotia and supported by all banks in Matadors reserves-based credit facility Facility initially sized at 250 million and includes accordion feature, which…
Hedging Profile 2019 2020 Hedges(1) Oil (WTI) Costless Collars: 4.9 million barrels hedged for 2019 at weighted average floor and ceiling prices of 54/Bbl and 72/Bbl, respectively Oil (WTI) Costless Participating Three-Way Collars(2):…
Appendix NYSE: MTDR
Adjusted EBITDA Reconciliation The following table presents our calculation of Adjusted EBITDA and reconciliation of Adjusted EBITDA to the GAAP financial measures of net income (loss) and net cash provided by operating activities,…
Adjusted EBITDA Reconciliation The following table presents our calculation of Adjusted EBITDA and reconciliation of Adjusted EBITDA to the GAAP financial measures of net income (loss) and net cash provided by operating activities,…
Adjusted EBITDA Reconciliation San Mateo Midstream, LLC(1) The following table presents the calculation of Adjusted EBITDA and reconciliation of Adjusted EBITDA to the GAAP financial measures of net income (loss) and net cash provided…
Adjusted Net Income and Adjusted Earnings Per Diluted Common Share This presentation includes the non-GAAP financial measures of adjusted net income and adjusted earnings per diluted common share. These non-GAAP items are measured as…
PV-10 Reconciliation PV-10 is a non-GAAP financial measure and generally differs from Standardized Measure, the most directly comparable GAAP financial measure, because it does not include the effects of income taxes on future net…
 Loading...