INTERNATIONALLY DIVERSIFIED SUSTAINABLE GROWTH AND INCOME Fourth Quarter and Year End 2018 Conference Call FEBRUARY 28, 2019
Q4 2018 REVIEW Q4/18 vs Q4 2018 Q3 2018 Q3/18 France (boe/d) 11,454 11,407 - Q4 production averaged a record 101,621 boe/d, a 6% increase over Q3 driven by growth in our Netherlands, Netherlands (boe/d) 8,749 7,479 17% Canadian…
FULL YEAR 2018 REVIEW 2018 vs 2018 2017 2018 production increased by 28% year-over-year to 2017 87,270 boe/d (10% per share), within 1% of the mid-point France (boe/d) 11,396 11,085 3% of our guidance range Netherlands (boe/d)…
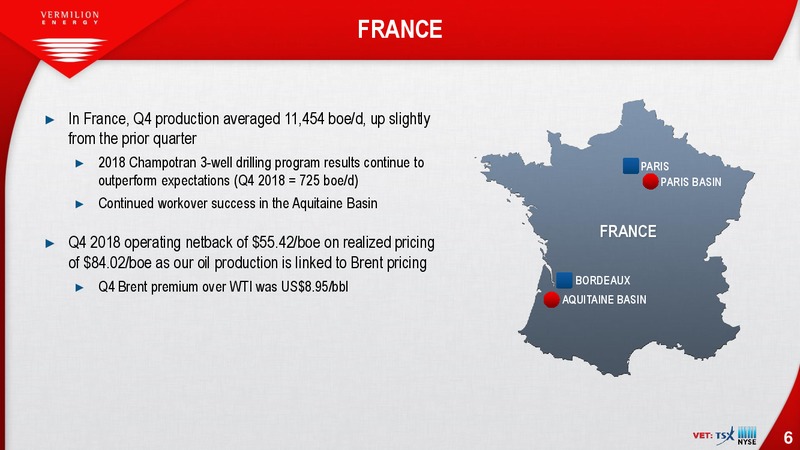
FRANCE In France, Q4 production averaged 11,454 boe/d, up slightly from the prior quarter 2018 Champotran 3-well drilling program results continue to PARIS outperform expectations (Q4 2018 = 725 boe/d) PARIS BASIN Continued…
NETHERLANDS In the Netherlands, Q4 production averaged 8,749 boe/d, an increase of 17% from the prior quarter HARLINGEN Full quarter contribution from the Eesveen-02 well (60% WI), which we brought on production late in the third…
IRELAND In Ireland, Q4 production averaged 52 mmcf/d (8,672 boe/d), an increase of 1% from the prior quarter Higher uptime compared to Q3 and incremental 1.5% interest added in December During the quarter, we assumed operatorship…
GERMANY In Germany, production in Q4 averaged 3,736 boe/d, an increase of 7% from the prior quarter Restoration of gas processing at a non-operated gas NORTH GERMAN processing facility BASIN HANNOVER During the fourth quarter,…
CEE In Central and Eastern Europe, production averaged 477 boe/d in Q4, an increase of 145% over the prior quarter Full quarter of production from the well brought on production in Q3 in the South Battonya concession in Hungary…
CANADA In Canada, production averaged a record 60,814 boe/d in Q4, representing an increase of 6% from the previous quarter Strong operating performance and new well completions in both Saskatchewan and Alberta, partially offset by…
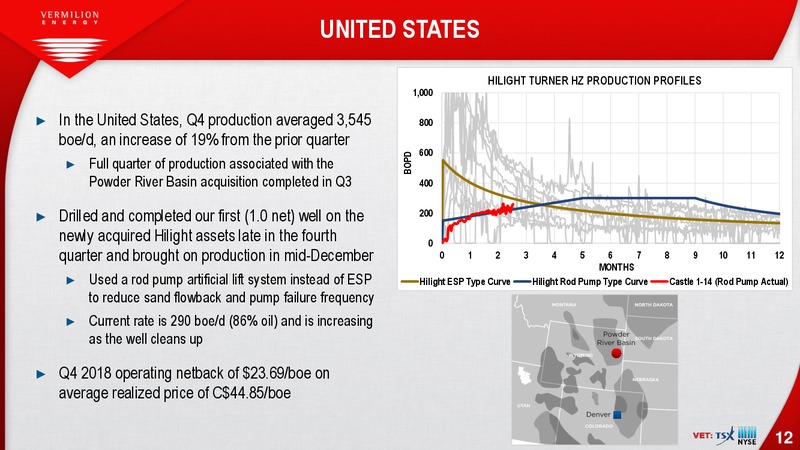
UNITED STATES HILIGHT TURNER HZ PRODUCTION PROFILES 1,000 In the United States, Q4 production averaged 3,545 800 boe/d, an increase of 19% from the prior quarter 600 BOPD Full quarter of production associated with the Powder…
AUSTRALIA In Australia, Q4 production averaged 4,174 bbl/d, down 11% from the previous quarter Decrease due to a planned shutdown for maintenance and WANDOO other downtime required to allow drilling of two new wells Began…
AUSTRALIA TWO-WELL DRILLING PROGRAM RESULTS The B15 and B16 wells were the most technically challenging wells ever executed at Vermilion Vertical depths of approximately 650 meters, but with measured depths of 4,960 meters and…
GLOBAL CRUDE OIL PRICING ADVANTAGE Q4 2018 Actual March 2019 Approximately 36% of Vermilions crude oil production is priced Reference 2019E Premium / with reference to Dated Brent* Oil Price Premium / Crude Oil (Discount) to…
2018 RESERVE REPORT Based on an independent report by GLJ, our reserves as at December 31, 2018 are as follows: Proved plus probable (2P) reserves increased 63% to 488 mmboe, proved (1P) reserves increased 69% to 298 mmboe, and…
2018 RESERVE REPORT Replaced 187% of 2P reserves, 157% of 1P reserves and 130% of PDP reserves through development activities* Including acquisitions, replaced 695% of 2P reserves, 481% of 1P reserves and 314% of PDP reserves…
2019 SUSTAINABILITY 2019 E&D capital budget of 530MM 1,200 includes both sustaining and growth capital US60 WTI 1,000 Dividend and sustaining capital covered at US50 WTI US40 WTI and growth capital covered at 800 US40 WTI US50…
2018 ESG PERFORMANCE Named to the CDP Climate Leadership Level (A-) for the second consecutive year in 2018 We were again the only Canadian oil and gas company and one of only two North American oil and gas companies to receive this…
 Loading...