Skip to main contentRaymond James and Associates 40th Annual Institutional Investors Conference – Williams Companies, Inc. Investor Presentation | Shale Experts
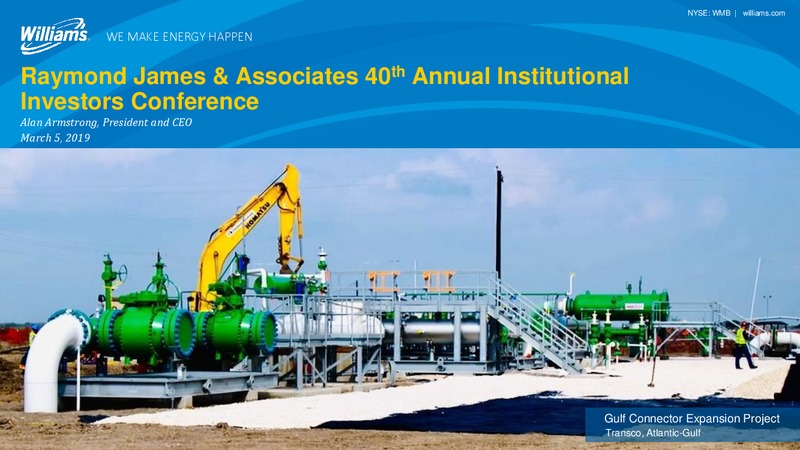
NYSE: WMB williams.com WE MAKE ENERGY HAPPEN Raymond James & Associates 40th Annual Institutional Investors Conference Alan Armstrong, President and CEO March 5, 2019 Gulf Connector Expansion Project Transco, Atlantic-Gulf
Williams is a unique large-scale, low-volatility, growing natural gas infrastructure company with high quality revenues STABILITY GROWTH YIELD & COVERAGE Irreplaceable asset base handling 30% of Nations largest and fastest growing…
Consistently delivering on our promises Key 2018 results exceeded guidance midpoints In Billions except for percentages, ratios and per share amounts 2018 GUIDANCE1 0.193 (Reported) 1.108 (Adjusted) Net Income 0.975 1.075 1.175…
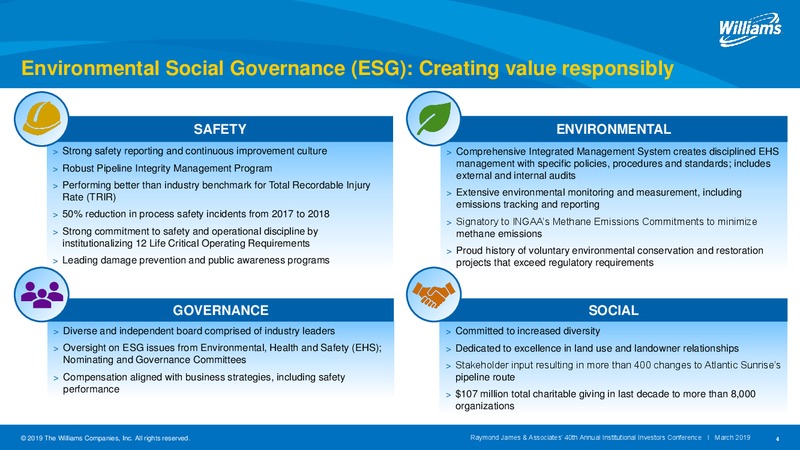
Environmental Social Governance (ESG): Creating value responsibly SAFETY ENVIRONMENTAL Strong safety reporting and continuous improvement culture Comprehensive Integrated Management System creates disciplined EHS Robust Pipeline…
Consistent strategy focused on natural gas volume growth WILLIAMS HANDLES 30% OF U.S. NATURAL GAS VOLUMES Gas End Users Industrial Residential/ Commercial Wellhead Gathering Gas Processing Plants Natural Gas (onshore and…
Connecting the best supplies to the best markets with advantaged infrastructure Williams U.S. Asset Map NORTHEAST G&P Operating Area Large-scale asset footprint in place Significant production growth driven by infrastructure…
Irreplaceable infrastructure supplying some of the nations largest cities U.S. Counties Color-coded by Population Density vs. Williams Regulated Northwest Natural Gas Pipelines Pipeline Legend Transco Population per sq. mile…
Natural gas will continue to win global market share NATURAL GAS VS. OIL DEMAND GROWTH (2011 TO 2027); HENRY HUB AND WTI PRICES (MMBTU) 18 45% Cumulative Global Demand Growth Since 11 Forecast 16 40% 14 35% Oil & Gas Price in…
Robust domestic and global natural gas demand forecasts continue to rise, reaching 103 Bcf/d by 2021 2018 UNITED STATES PRODUCTION UNITED STATES NATURAL GAS DEMAND BY SECTOR (20142021) BY REGION IN BCF/D 120 5 105 4.37 CAGR 17-18:…
Natural gas continues to be the preferred fuel type for new power generation projects in the United States, followed by renewables Power Generation Projects Under Construction Fuel Type of Carbon intensity from the U.S. power sector by…
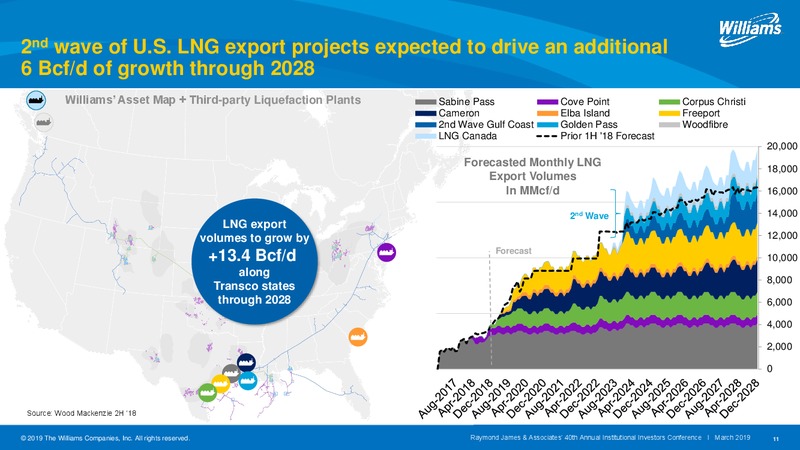
2nd wave of U.S. LNG export projects expected to drive an additional 6 Bcf/d of growth through 2028 Williams Asset Map + Third-party Liquefaction Plants Sabine Pass Cove Point Corpus Christi Cameron Elba Island Freeport 2nd Wave Gulf…
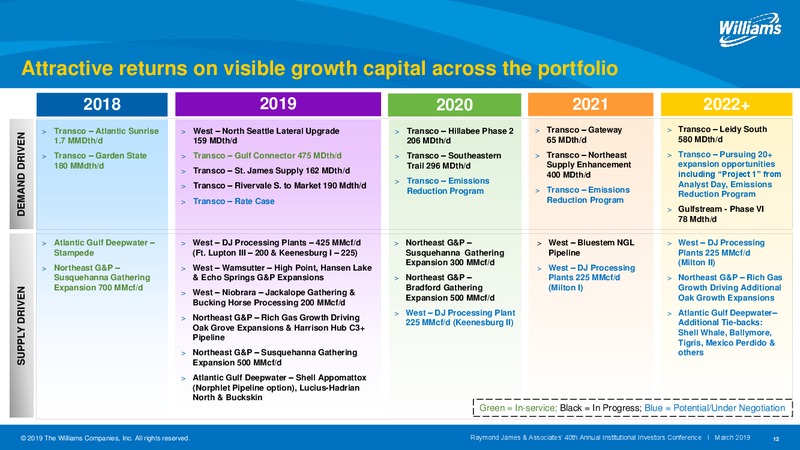
Attractive returns on visible growth capital across the portfolio 2018 2019 2020 2021 2022+ Transco Atlantic Sunrise West North Seattle Lateral Upgrade Transco Hillabee Phase 2 Transco Gateway Transco Leidy South DEMAND DRIVEN 1.7…
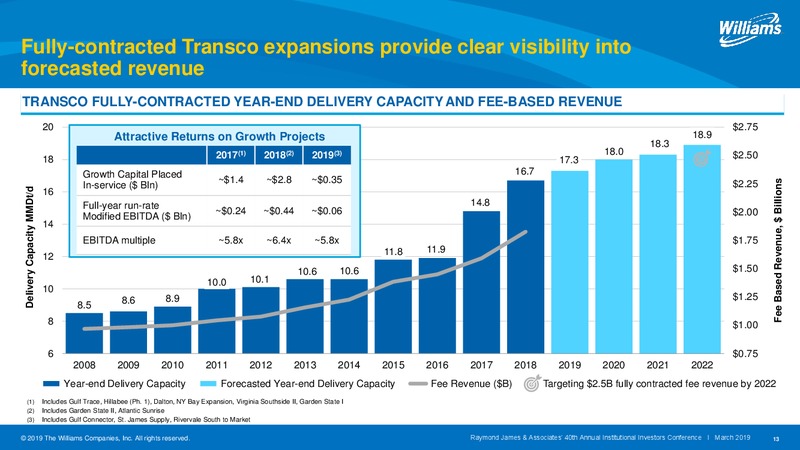
Fully-contracted Transco expansions provide clear visibility into forecasted revenue TRANSCO FULLY-CONTRACTED YEAR-END DELIVERY CAPACITY AND FEE-BASED REVENUE 20 2.75 Attractive Returns on Growth Projects 18.9 18.3 2017(1) 2018(2)…
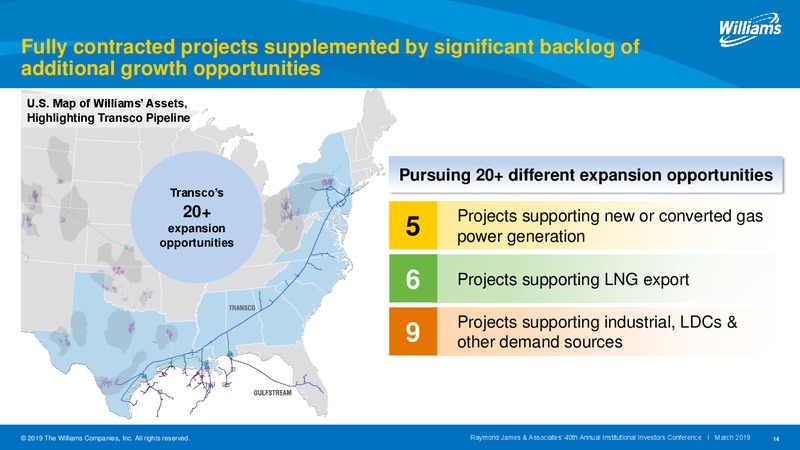
Fully contracted projects supplemented by significant backlog of additional growth opportunities U.S. Map of Williams Assets, Highlighting Transco Pipeline Pursuing 20+ different expansion opportunities Transcos 20+ Projects…
Northeast G&P: Large footprint with room to grow UTICA SUSQUEHANNA SUPPLY SUPPLY HUB(1) HUB Cardinal Gathering(3) 3.6 Bcf/d of gathering capacity in Flint Gathering dry gas Utica East Ohio (UEO)(2) BRADFORD 2.7 Bcf/d of gathering…
Key producers in prime acreage driving Northeast G&P growth 1 BCF/D NORTHEAST GATHERING VOLUME GROWTH: DRIVERS OF EXPECTED 15% NORTHEAST GATHERING VOLUME 4Q 2018 vs. 4Q 2017 (BCF/D) CAGR 2018-2021 8 NORTHEAST PENNSYLVANIA 14% 5+…
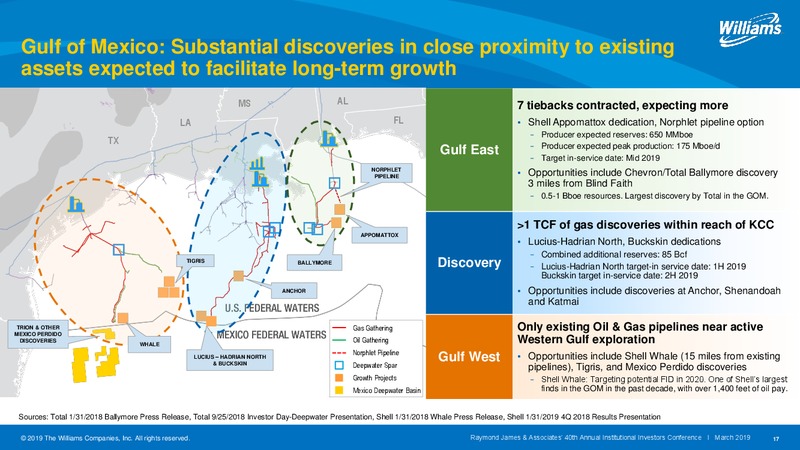
Gulf of Mexico: Substantial discoveries in close proximity to existing assets expected to facilitate long-term growth MS AL 7 tiebacks contracted, expecting more LA FL Shell Appomattox dedication, Norphlet pipeline option Producer…
Bluestem Pipeline Project: Strategic partnership connecting Western supplies to Gulf Coast markets Growing NGL production from West G&P assets driving need for incremental connectivity to premium markets Delivers a long-term…
Fee-based business structure reinforces stability in cash flows 97% of 2019 Gross Margin from Fee-based Sources 2019 Gross Margin (1) 3% NGL and Other Commodity 38% Regulated Gas Pipeline Exposure Fee-based Revenue Reduced commodity…
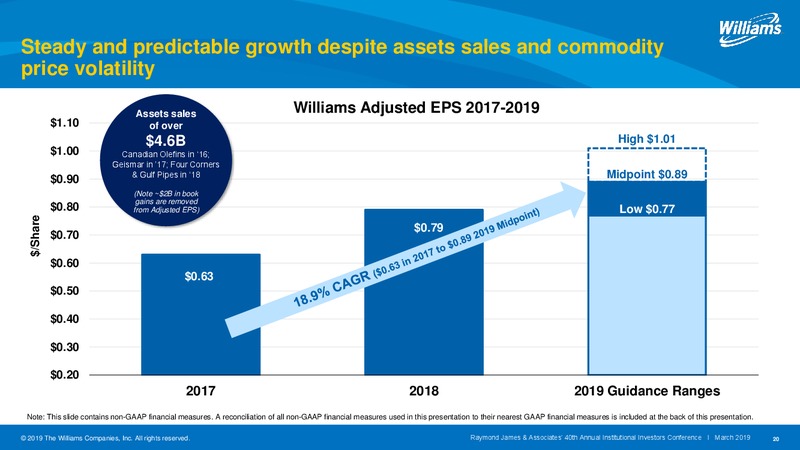
Steady and predictable growth despite assets sales and commodity price volatility Assets sales Williams Adjusted EPS 2017-2019 1.10 of over 4.6B High 1.01 1.00 Canadian Olefins in 16; Geismar in 17; Four Corners 0.90 & Gulf Pipes…
Reaffirming 2019 guidance metrics Adjusted EBITDA growth driven by Transco and NE G&P fee-based revenue In Billions except for percentages, ratios and per share amounts 2019 GUIDANCE Net Income 1.050 - 1.350 Bn Adjusted EPS 0.77 -…
Williams, an unmatched natural gas infrastructure investment STABILITY GROWTH YIELD & COVERAGE Irreplaceable asset base handling 30% of Nations largest and fastest growing Attractive current dividend yield of 5.6%(1) low-cost U.S.…
Forward Looking Statements 2019 The Williams Companies, Inc. All rights reserved. Raymond James & Associates 40th Annual Institutional Investors Conference I March 2019 23
FORWARD-LOOKING STATEMENTS Forward-looking statements The reports, filings, and other public announcements of The Williams Companies, Inc. (Williams) may contain or incorporate by reference statements that do not directly or…
FORWARD-LOOKING STATEMENTS Forward-looking statements (contd) Forward-looking statements are based on numerous assumptions, uncertainties and risks that could cause future events or results to be materially different from those…
FORWARD-LOOKING STATEMENTS Forward-looking statements (contd) Risks associated with weather and natural phenomena, including climate conditions and physical damage to our facilities; Acts of terrorism, cybersecurity incidents, and…
Non-GAAP Reconciliations 2019 The Williams Companies, Inc. All rights reserved. Raymond James & Associates 40th Annual Institutional Investors Conference I March 2019 27
NON-GAAP RECONCILIATIONS Reconciliation of Income (Loss) Attributable to The Williams Companies, Inc. to Adjusted Income 2017 2018 (Dollars in millions, except per-share amounts) 1st Qtr 2nd Qtr 3rd Qtr 4th Qtr Year 1st Qtr 2nd Qtr…
NON-GAAP RECONCILIATIONS Reconciliation of Income (Loss) Attributable to The Williams Companies, Inc. to Adjusted Income (cont) 2017 2018 (Dollars in millions, except per-share amounts) 1st Qtr 2nd Qtr 3rd Qtr 4th Qtr Year 1st Qtr 2nd…
NON-GAAP RECONCILIATIONS Reconciliation of Net Income to Adjusted Net Income (Dollars in millions) 2018 Net Income 193 Adjustments (1) Total adjustments 1,095 Allocation of adjustments to noncontrolling interests (16) Tax…
NON-GAAP RECONCILIATIONS Reconciliation of Income (Loss) Attributable to The Williams Companies, Inc. to Adjusted Income (cont) GUI DANCE RANGES 2018 2019 Midpt. High Low Midpt. High (Dol l a rs i n mi l l i ons , except per-s ha re…
NON-GAAP RECONCILIATIONS Reconciliation of Income (Loss) Attributable to The Williams Companies, Inc. to Adjusted Income (cont) 2018 Guidance 2018 Guidance (Dollars in m illion s , excep t p er-s h are am ou n ts ) Midpoint High…
NON-GAAP RECONCILIATIONS Reconciliation of Net Income to Modified EBITDA, Adjusted EBITDA and Distributable Cash Flow 2017 2018 (Dollars in millions, except coverage ratios) 1st Qtr 2nd Qtr 3rd Qtr 4th Qtr Year 1st Qtr 2nd Qtr 3rd Qtr…
NON-GAAP RECONCILIATIONS Reconciliation of Modified EBITDA to Non-GAAP Adjusted EBITDA 2017 2018 (Dollars in millions) 1st Qtr 2nd Qtr 3rd Qtr 4th Qtr Year 1st Qtr 2nd Qtr 3rd Qtr 4th Qtr Year Northeast G&P 226 247 115 231 819…
NON-GAAP RECONCILIATIONS Reconciliation of Net Income to Modified EBITDA and Non-GAAP Adjusted EBITDA 2018 2019 ( in billions) Guidance Guidance Low Mid High Low Mid High Net income (loss) 0.975 1.075 1.175 1.050 1.200 1.350…
 Loading...