Table of Contents ? 4Q18 Financial Recap ? Operational Highlights ? CapEx and Liquidity ? Well Services ? Water Logistics ? Completion & Remedial Services ? 4Q18 Takeaways ? 2019 Outlook ? Non-GAAP Reconciliation
4Q 2019 Financial Recap (in millions) Three Months Ended 12/31/18 9/30/18 12/31/17 Revenue Well Servicing $61.8 $67.2 $54.5 Water Logistics 55.6 59.5 55.5 Contract Drilling 4.1 3.6 3.3 Completion & Remedial 108.9 116.0 122.0…
4Q 2018 Operational Highlights • Adjusted EBITDA margins at 9.5% compared to 10.1% from 3Q18, despite sequential revenue decline of 6.5% • $7.0 mm revenue decline 3Q18 to 4Q18 in C&R segment due to lower sand volumes and the…
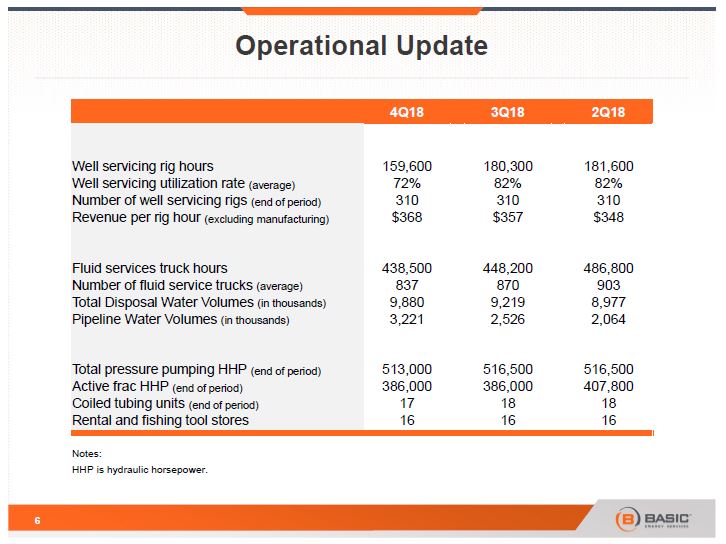
4Q18 3Q18 2Q18 Well servicing rig hours 159,600 180,300 181,600 Well servicing utilization rate (average) 72% 82% 82% Number of well servicing rigs (end of period) 310 310 310 Revenue per rig hour (excluding manufacturing) $368 $357…
CapEx, Liquidity and Free Cash Flow • Capital expenditures (including capital leases) for 4Q18 totaled $19.7 mm • Maintenance/sustaining expenditures were $18.7 mm • Expansion projects and other totaled $1.0 mm • 2019 capital…
Well Services Operational Highlights Segment Revenue Breakdown • Rigs working with 24-hour packages averaged 23 in 4Q, flat from 3Q • Utilization was a seasonally strong 72% despite an unusually large weather impact in October •…
Water Logistics Operational Highlights Segment Revenue Breakdown • Margins continue to improve, up 90 bps to 29%, as volumes of water disposal via pipe continues to climb, up 28% sequentially to 3.2 mm bbls • Approximately 33% of SWD…
Completion and Remedial Services Operational Highlights Segment Revenue Breakdown • Margin declined 90 bps in 4Q18 vs. 3Q18 on lower revenue, largely from lower frac activity, weather and holidays, as well as lower sand sales due to…
2019 Outlook • We expect the first quarter revenue to be down 11%-14% from fourth quarter levels • Well Services and Water Logistics should see a sequential increase in revenue of low- to mid-single digits during Q1; pricing to remain…
Non-GAAP Reconciliation (in millions) Three Months Ended 12/31/18 9/30/18 12/31/17 Net Loss ($46.7) ($27.3) ($20.3) Adjustments Income Tax Provision (Benefit) 0.0 0.0 (0.3) Loss on Extinguishment of Debt 26.4 0.0 0.0 Interest…
Non-GAAP Reconciliation This presentation contains references to the non-GAAP financial measure of free cash flow, which is defined as net cash provided by operating activities in a period minus capital expenditures for sustaining and…
 Loading...