Santos profile (ASX: STO, US ADR: SSLZY) Santos purpose is to provide sustainable returns for our shareholders by supplying reliable, affordable and cleaner energy to improve the lives of people in Australia and Asia DIVERSIFIED AND…
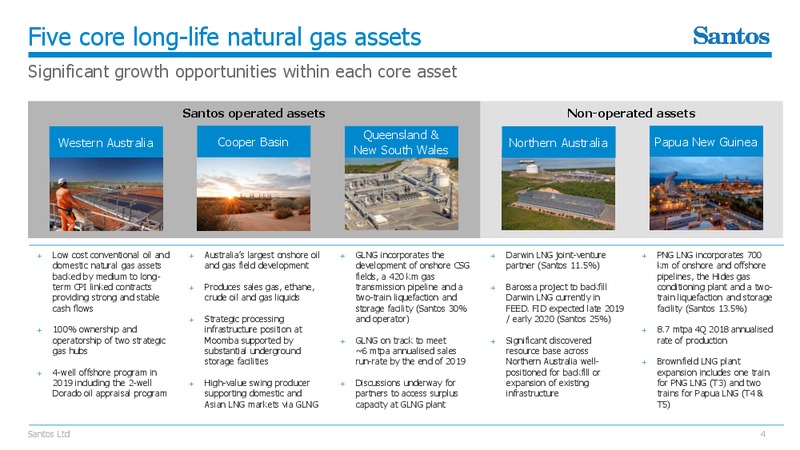
Five core long-life natural gas assets Significant growth opportunities within each core asset Santos operated assets Non-operated assets Queensland & Western Australia Cooper Basin Northern Australia Papua New Guinea New South…
2018 Full-year highlights Clear strategy and disciplined Operating Model driving strong cash flow and financial strength RECORD FREE CASH FLOW1 RECORD UNDERLYING NPAT RECORD EBITDAX 1,006 727 2,160 112% 63% 129% 51% million…
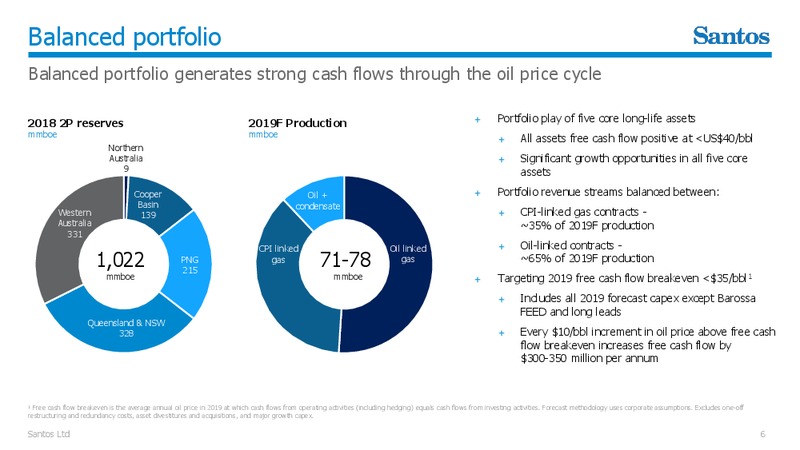
Balanced portfolio Balanced portfolio generates strong cash flows through the oil price cycle 2018 2P reserves 2019F Production + Portfolio play of five core long-life assets mmboe mmboe + All assets free cash flow positive…
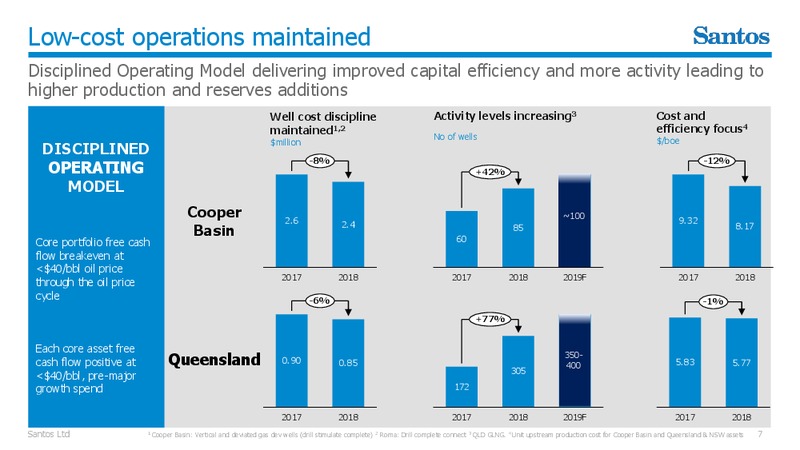
Low-cost operations maintained Disciplined Operating Model delivering improved capital efficiency and more activity leading to higher production and reserves additions Well cost discipline Activity levels increasing3 Cost and…
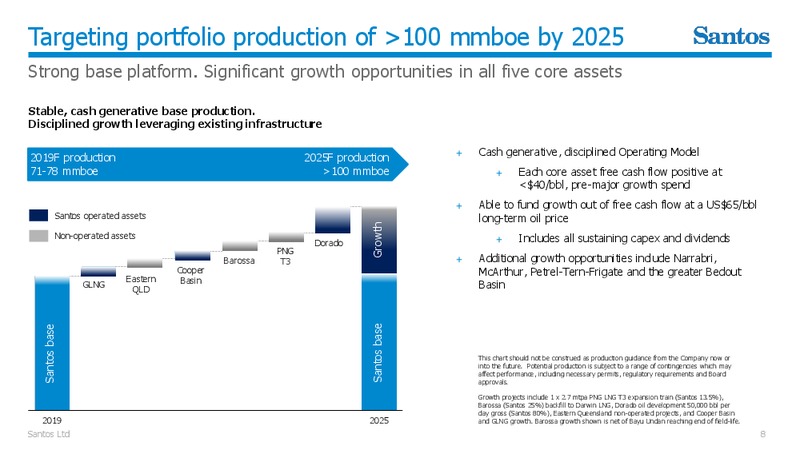
Targeting portfolio production of 100 mmboe by 2025 Strong base platform. Significant growth opportunities in all five core assets Stable, cash generative base production. Disciplined growth leveraging existing infrastructure + Cash…
Safety and sustainability Our vision is to be the safest and lowest-cost operator Safety Lost time injury frequency rate (LTIFR) + Implementation of Santos Safety Strategy Rate per million hours worked No of onshore wells + 2018 saw…
Finance & capital management
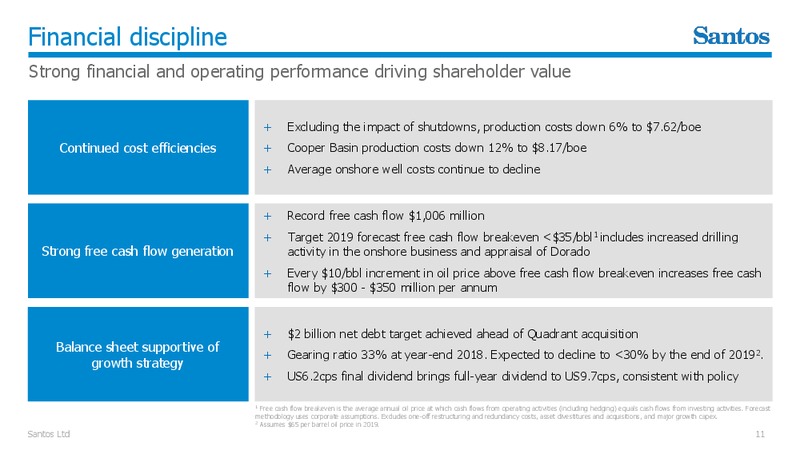
Financial discipline Strong financial and operating performance driving shareholder value + Excluding the impact of shutdowns, production costs down 6% to 7.62/boe Continued cost efficiencies + Cooper Basin production costs down 12%…
Strong underlying earnings Underlying NPAT up 129% to 727 million Product sales revenue EBITDAX Underlying NPAT1 million million million +18% +129% +51% 3,660 2,160 727 3,100 2,594 2,442 1,454 1,428 1,199 318 54 75…
Strong free cash flow generation Free cash flow up 63% to 1,006 million Operating cash flow Investing cash flow1 Free cash flow1 million million million +26% +63% 1,578 (1,550) 1,006 1,248 618 811 840 -9% (634) (630)…
Cash generative Operating Model continues to drive value Diversified portfolio delivering EBITDAX growth and strong margins across all assets 2018 Full-year results summary1 + Sales revenue up 18% due to a strong operating Cooper Qld…
Capital expenditure 2018 full-year capex 759 million. 2019 guidance 1.1 billion 2018 capital expenditure1 Onshore efficiencies. 2019 capex guidance1 759 million More wells for less capex per well 1.1 billion + Cooper Basin 100 wells +…
Drawn debt maturity profile Gross debt of 4.4 billion down from 4.9 billion at 31 December 2018 following recent refinancing and repayments. Strong liquidity with undrawn debt facilities of 2.0 billion. No material near-term maturities…
Operations overview
Cooper Basin Cooper Basin production growing again + Production up 8% to 15.5 mmboe Average daily net production + Achieved highest monthly average oil production rates since 2009 mboepd + Disciplined focus on sustainable cost…
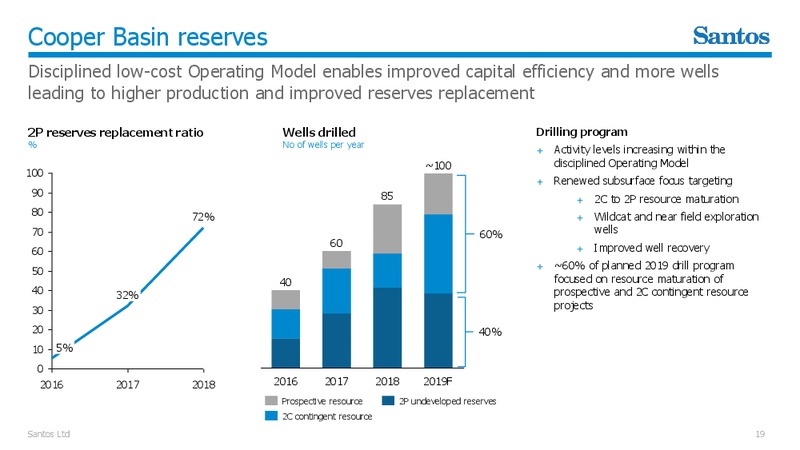
Cooper Basin reserves Disciplined low-cost Operating Model enables improved capital efficiency and more wells leading to higher production and improved reserves replacement 2P reserves replacement ratio Wells drilled Drilling program %…
Cooper Basin resource opportunity Deep inventory of contingent and prospective resource project opportunities provides the foundation for ongoing development of the Cooper Basin Moomba South appraisal 2C contingent resource to Cooper…
Queensland and NSW GLNG on track to meet 6 mtpa annualised sales run-rate including LNG volumes redirected to the domestic market by the end of 2019 GLNG equity gas production building + 2018 LNG equivalent production 5.5 mt + First gas…
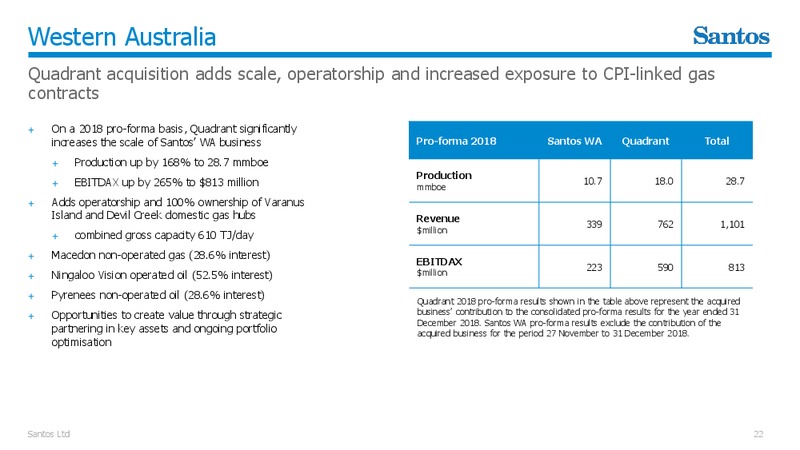
Western Australia Quadrant acquisition adds scale, operatorship and increased exposure to CPI-linked gas contracts + On a 2018 pro-forma basis, Quadrant significantly increases the scale of Santos WA business Pro-forma 2018 Santos WA…
Western Australia exploration and appraisal Significant near-term development opportunities in shallow, shelf waters of the Carnarvon and Bedout Basins + Van Gogh (Ningaloo Vision) infill program successfully completed (Santos 52.5%) +…
Northern Australia Successful delivery of the Bayu Undan infill well project. Barossa FEED progressing Bayu Undan / Darwin LNG + 3-well Bayu Undan infill project delivered 40% under budget and the final well brought on-line more than…
PNG growth through expansion Potential expansion involves the construction of three additional trains at the PNG LNG site Upstream expansion + Santos farm-in to Pnyang proposal received and under negotiation + Potential Pnyang…
Summary Low-cost, diversified portfolio generating strong cash flow. Balance sheet supportive of growth strategy and sustainable dividends Record free cash flow and underlying profit Cost discipline maintained Strong reserves…
Appendix
Reserves and resources 2P reserves increased by 20% to 1,022 mmboe after production (395% RRR) Near-term major growth project FIDs potential to commercialise 300 mmboe 2C to 2P reserves 2P Reserves 2C Contingent resources mmboe mmboe…
2018 Full-year financial snapshot Underlying profit up 129% to 727 million million 2018 2017 Change Product sales revenue 3,660 3,100 18% EBITDAX 2,160 1,428 51% Underlying profit1 727 318 129% Net profit (loss) after tax 630…
Production and sales volumes Core asset production higher in 2018. Quadrant acquisition provides significant boost in 2019 Production Sales volume mmboe mmboe 71-78 88-98 84.1 83.4 61.6 59.5 58.9 78.3 57.7 64.3 2015 2016 2017…
Production costs Continued cost discipline. Normalised unit production costs down 6% to 7.62/boe + Sustained cost improvement and operating efficiencies Upstream unit production costs /boe + Unit upstream production costs 8.05/boe…
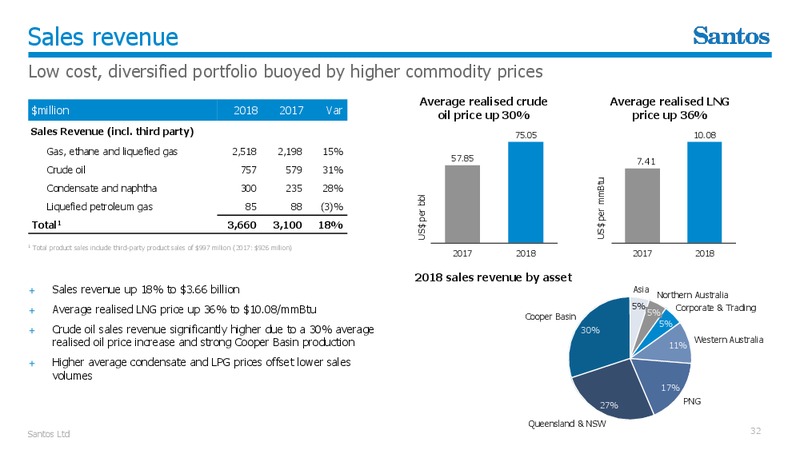
Sales revenue Low cost, diversified portfolio buoyed by higher commodity prices Average realised crude Average realised LNG million 2018 2017 Var oil price up 30% price up 36% Sales Revenue (incl. third party) 75.05 10.08 Gas, ethane…
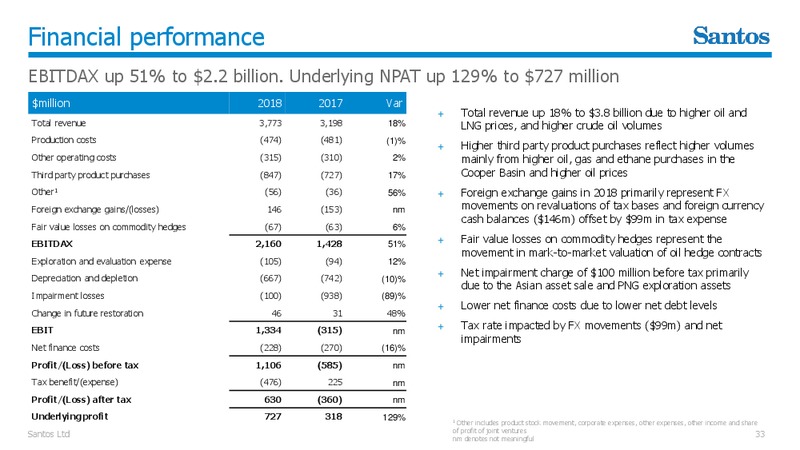
Financial performance EBITDAX up 51% to 2.2 billion. Underlying NPAT up 129% to 727 million million 2018 2017 Var + Total revenue up 18% to 3.8 billion due to higher oil and Total revenue 3,773 3,198 18% LNG prices, and higher crude…
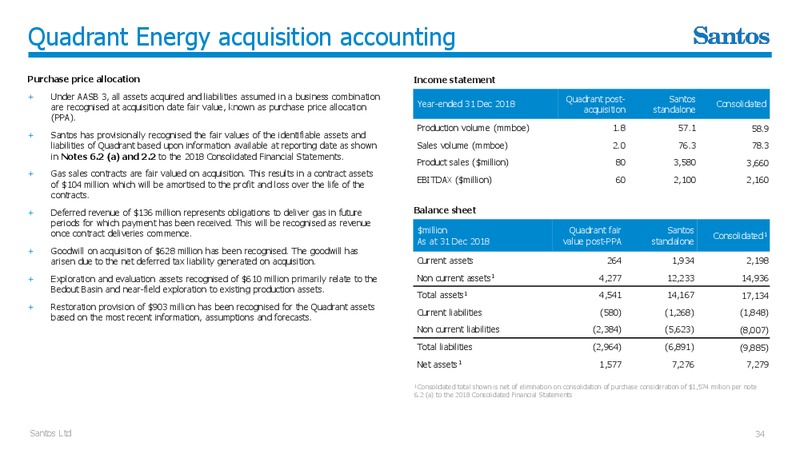
Quadrant Energy acquisition accounting Purchase price allocation Income statement + Under AASB 3, all assets acquired and liabilities assumed in a business combination Quadrant post- Santos are recognised at acquisition date fair value,…
Quadrant Energy summary financials Key metrics US million, year-ended 31 December 2016 2017 2018 Product sales 643 726 714 Other revenue (+) Tolling revenue - 19 27 (+) Other revenue 2 15 23 (+) Hedging gain 137 63 (13) Total…
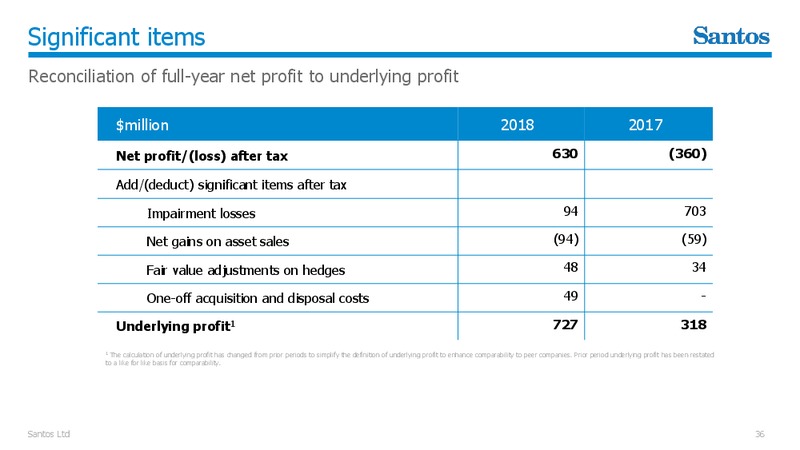
Significant items Reconciliation of full-year net profit to underlying profit million 2018 2017 Net profit/(loss) after tax 630 (360) Add/(deduct) significant items after tax Impairment losses 94 703 Net gains on asset sales (94)…
2019 Guidance 2019 capex guidance 2019 guidance + Western Australia 400m including Sales volumes 88-98 mmboe + Corvus-2 appraisal Production 71-78 mmboe + Dorado 2-well appraisal + Roc South-1 NFE Upstream 7.50-8.00/boe +…
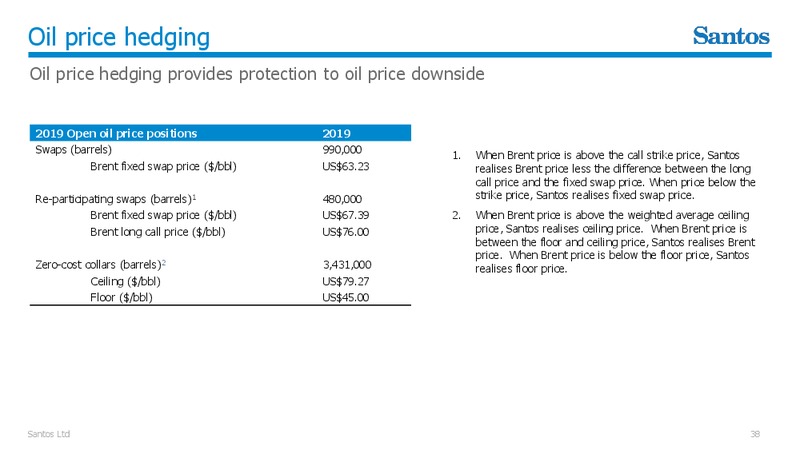
Oil price hedging Oil price hedging provides protection to oil price downside 2019 Open oil price positions 2019 Swaps (barrels) 990,000 1. When Brent price is above the call strike price, Santos Brent fixed swap price (/bbl)…
 Loading...