Current Corporate Snapshot Financial TSX: BNE Common Shares Outstanding 33.3 million Insider Ownership 25% Current Monthly Dividend 0.01 per share Current Annualized Yield (1) 2% Tax Pools at Dec 31, 2018 385 million Tax Horizon…
Consistent Strategy Bonterras focus will remain on generating strong, sustainable free cash flow which can be used to reduce debt, and as leverage is reduced look to increase the dividend A proven track record built on generating…
Bonterra: Focused on Fundamentals Bonterras proven track record has been built on a model of generating long-term, sustainable value through a combination of returning capital to shareholders via dividends and modest growth…
Long-Term Development Opportunities Concentrated assets in the Pembina Cardium oil pool support efficient operations and offer exposure to significant upside through a large inventory of low-risk, highly economic undrilled locations…
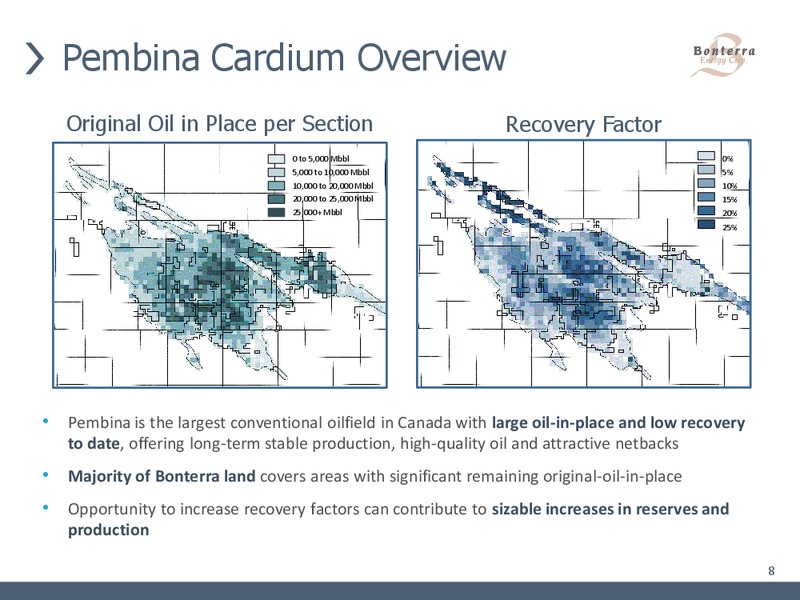
Pembina Cardium Overview Original Oil in Place per Section Recovery Factor 0 to 5,000 Mbbl 0% 5,000 to 10,000 Mbbl 5% 10,000 to 20,000 Mbbl 10% 20,000 to 25,000 Mbbl 15% 25,000+ Mbbl 20% 25% Pembina is the largest…
Asset Base Supports Sustainability BNE has the inventory and track record to support long-term sustainability and will balance the pace of development to optimize dividends depending on commodity prices Significant Cardium Location…
Average BNE Cardium Full Cycle Economics Cardium wells are repeatable, predictable and generate strong returns even in a weak commodity price environment 300 Reserves per well (MBOE) 165 250 IP (12 months) (boe/d) 112 200…
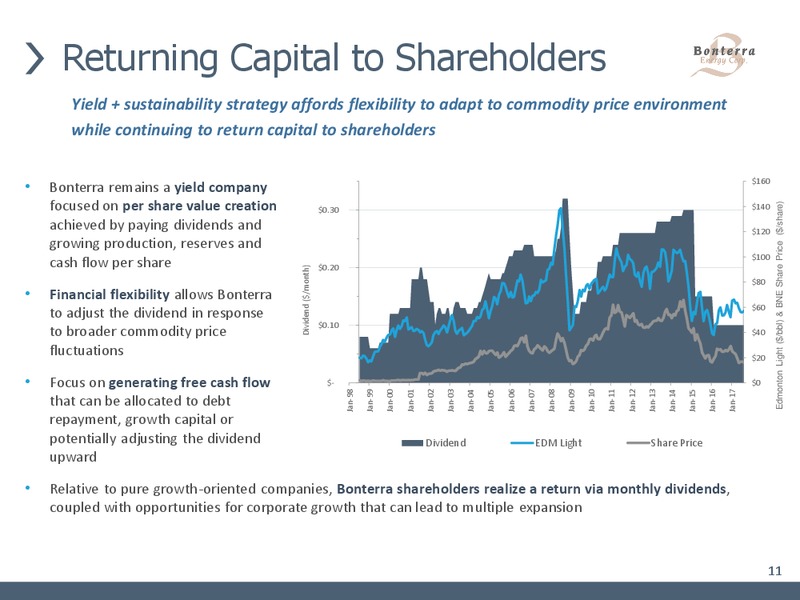
Returning Capital to Shareholders Yield + sustainability strategy affords flexibility to adapt to commodity price environment while continuing to return capital to shareholders Bonterra remains a yield company 160 focused on per…
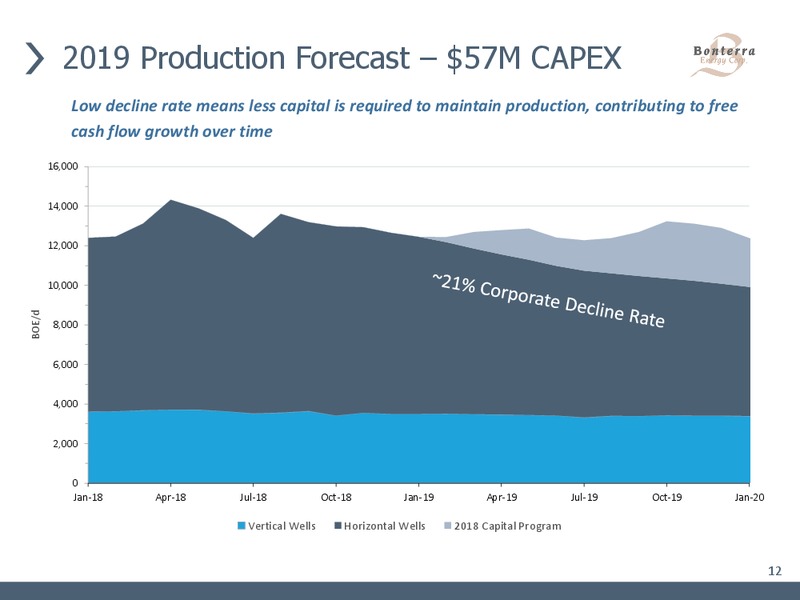
2019 Production Forecast 57M CAPEX Low decline rate means less capital is required to maintain production, contributing to free cash flow growth over time 16,000 14,000 12,000 10,000 21% Corporate Decline Rate BOE/d…
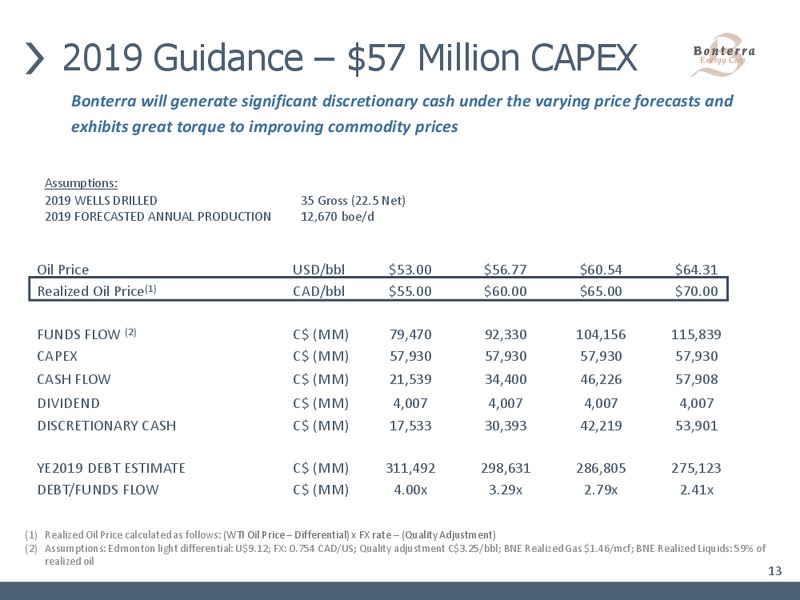
2019 Guidance 57 Million CAPEX Bonterra will generate significant discretionary cash under the varying price forecasts and exhibits great torque to improving commodity prices Assumptions: 2019 WELLS DRILLED 35 Gross (22.5 Net)…
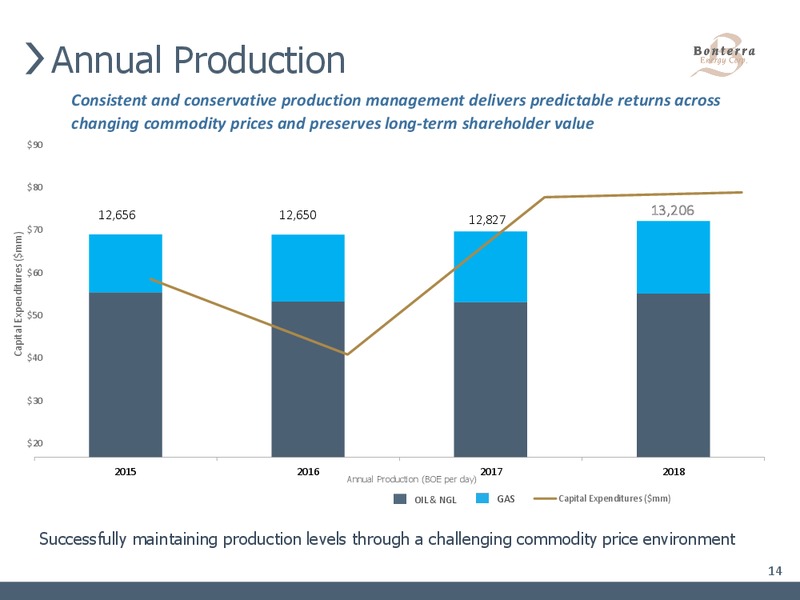
Annual Production Consistent and conservative production management delivers predictable returns across changing commodity prices and preserves long-term shareholder value 90 80 12,656 12,650 13,206 12,827 70 Capital…
Consistent Reserves Growth Bonterras demonstrated track record of reserves growth is +12% critical in supporting long-term sustainability P+P reserves growth 15 to 18 101,225 99,840 94,905 90,621 2015 2016 Gross Reserves 2017…
Building per Share Value Continuous value creation on a per share basis from 2015 to 2018 Production per Share Reserves per Share (BOE per share) (BOE per share) (P+P) 0.150 0.145 0.140 0.135 0.130 3.04 0.125 0.145 3.00…
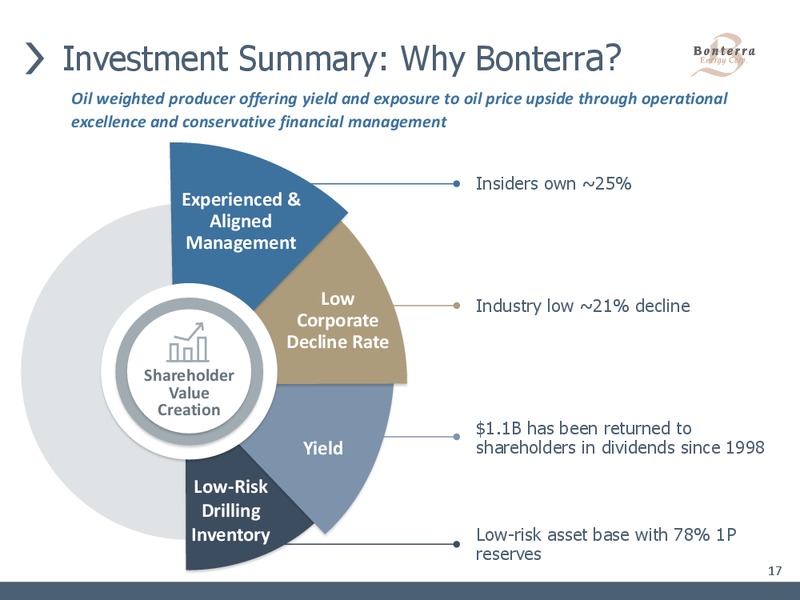
Investment Summary: Why Bonterra Oil weighted producer offering yield and exposure to oil price upside through operational excellence and conservative financial management Insiders own 25% Experienced & Aligned Management Low…
Appendix 18
Cash Flow Sensitivities Sensitivity Analysis(1) Cash Flow (estimate for 2018) Cash Flow Per Share(2) Per Annum Change of Canadian 1.00 per barrel of oil and NGLs 2,606,000 0.08 Change of Canadian 0.10 per MCF of natural gas…
Corporate Information OFFICERS G. F. Fink BANKS CEO & Chairman of the Board CIBC R. D. Thompson National Bank of Canada CFO & Corporate Secretary The Toronto Dominion Bank A. Neumann Alberta Treasury Branches Chief Operating Officer…
 Loading...