2017 – a year of strong delivery Underlying replacement cost profit $6.2bn Financial highlights Organic capital expenditure $16.5bn Underlying operating cash flow1 $24.3bn Divestment proceeds2 $4.3bn Gulf of Mexico oil spill…
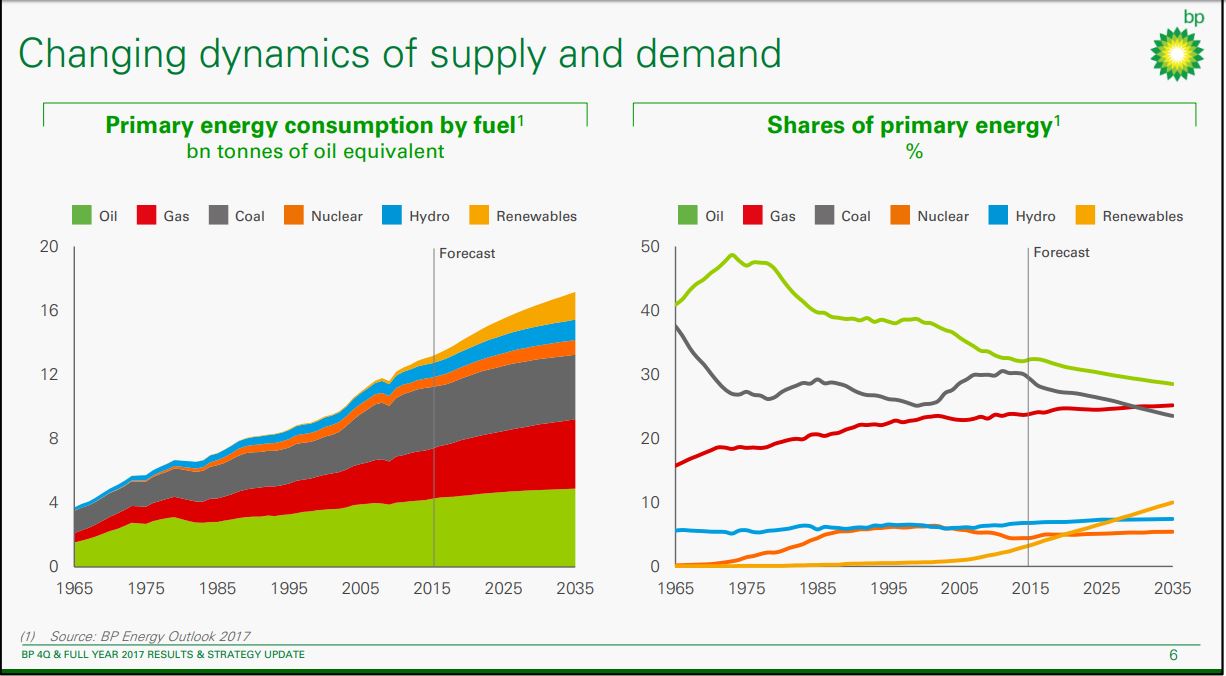
Primary energy consumption by fuel1 bn tonnes of oil equivalent 0 10 20 30 40 50 1965 1975 1985 1995 2005 2015 2025 2035 Oil Gas Coal Nuclear Hydro Renewables Shares of primary energy1 Primary energy consumption by fuel1 bn…
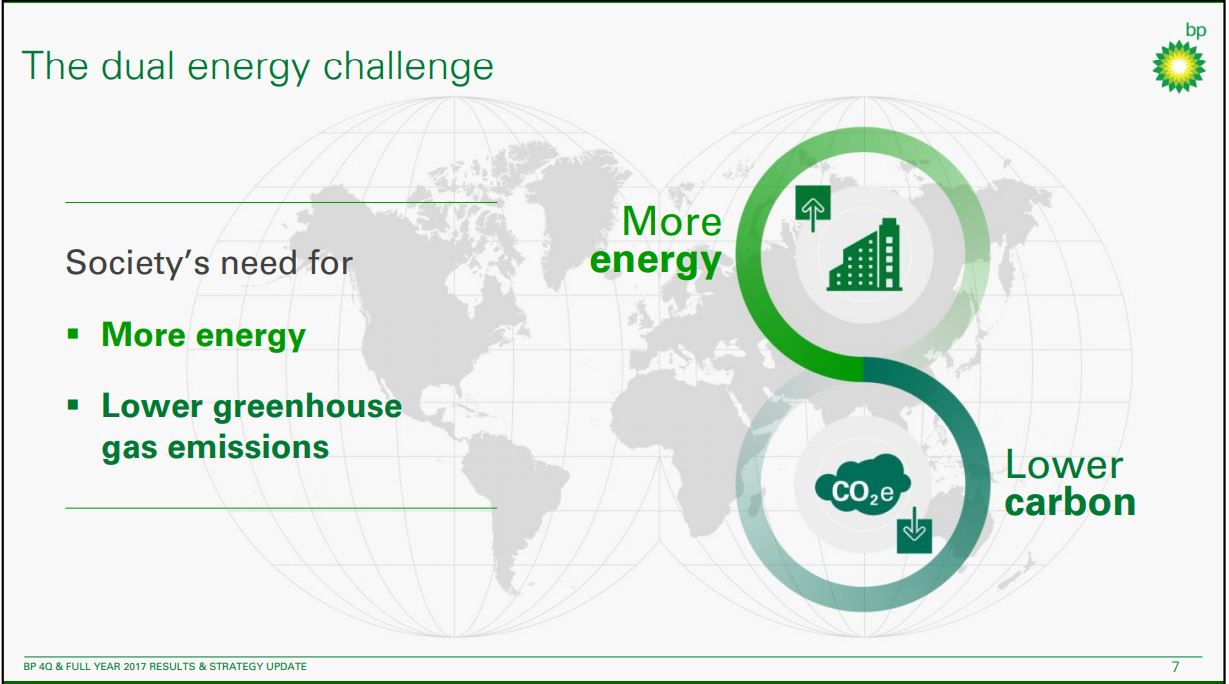
The dual energy challenge Society’s need for ? More energy ? Lower greenhouse gas emissions More energy Lower carbon
The BP proposition Safer Fit for the future Focused on returns Safe, reliable and efficient execution A distinctive portfolio fit for a changing world Value based, disciplined investment and cost focus Growing sustainable…
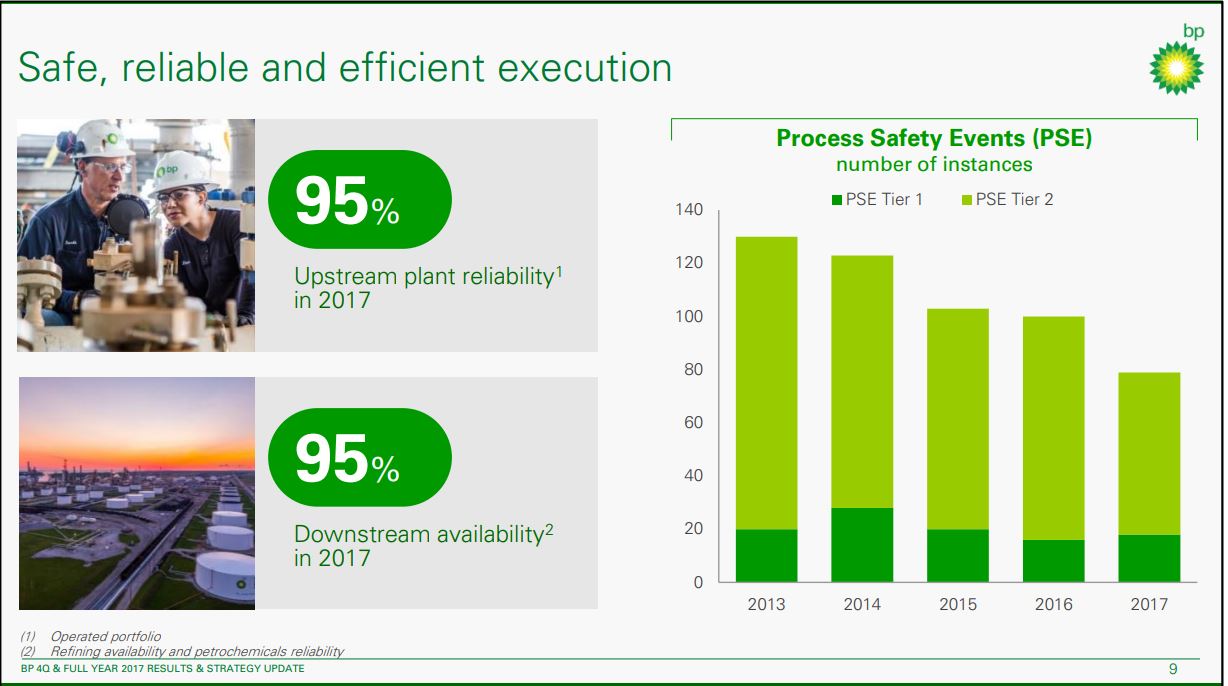
Safe, reliable and efficient execution Process Safety Events (PSE) number of instances 0 20 40 60 80 100 120 140 2013 2014 2015 2016 2017 PSE Tier 1 PSE Tier 2 (1) Operated portfolio (2) Refining availability and…
A distinctive portfolio Downstream Price leverage % operating cash flow2 Deep reserves base Proved reserves1 bn boe 18.4 Oil linked Gas linked Fixed + other (1) Estimated net proved reserves on an oil equivalent basis as at 31…
Distinctive partnership – Russia (1) BP share, preliminary (2) Replacement cost profit before interest and tax (RCPBIT), adjusted for non-operating items and fair value accounting effects (3) Transaction to be closed in 2018, subject…
Focused on returns ? Making the right choices to deliver competitive returns ? Capital and cost discipline ? Actively managed portfolio ROACE1 % 2.8 5 10% by 2021 ROACE1 Delivering competitive returns
Clear priorities for a changing world Growing gas and advantaged oil in the Upstream Modernising the whole Group Venturing and low carbon across multiple fronts Market led growth in the Downstream
The BP proposition Safer Fit for the future Focused on returns Safe, reliable and efficient execution A distinctive portfolio fit for a changing world Value based, disciplined investment and cost focus Growing sustainable…
 Loading...