Scotia Howard Weil 47th Annual Energy Conference March 25-27, 2019 www.icdrilling.com
Investment Thesis Sectors only pure-play, pad-optimal growth story focused solely on North Americas most attractive oil and gas basins Sidewinder strategic combination more than doubled fleet size by Scale, combining complementary…
Corporate Snapshot Proforma Capitalization & Liquidity: 12/31/18 (2) Sectors only pure play, pad-optimal USMM, unless otherwise noted growth story Share Price (/Share) 2.98 Share Outstanding (MM) 77.1 Fleet composed of 32 marketed…
ICD Today: Nothing has Changed but Everything is Different Post combination, ICDs strategic focus and operational priorities remain unchanged, but our ability to generate free cash flow and investor returns increased dramatically Pre…
Fleet & Operational Footprint 14 300 Series ShaleDriller Rigs(1) 1500 HP drawworks; 25K+ racking / 1M lb hook with only modest capex Oklahoma Three pump / four engine capable; drilling Arkansas optimization software capable New…
Geographic Mix and Customer Relationships Active Rig Count by Basin Strong Customer Base ICD Customers 25% 75% Permian Haynesville 7
Market Overview: Long-term View Oil prices generally range bound in Investor and capital market sentiment Continued innovation results in US shale forces E&Ps to focus on financial returns the 50bbl to 70bbl WTI range, plays becoming…
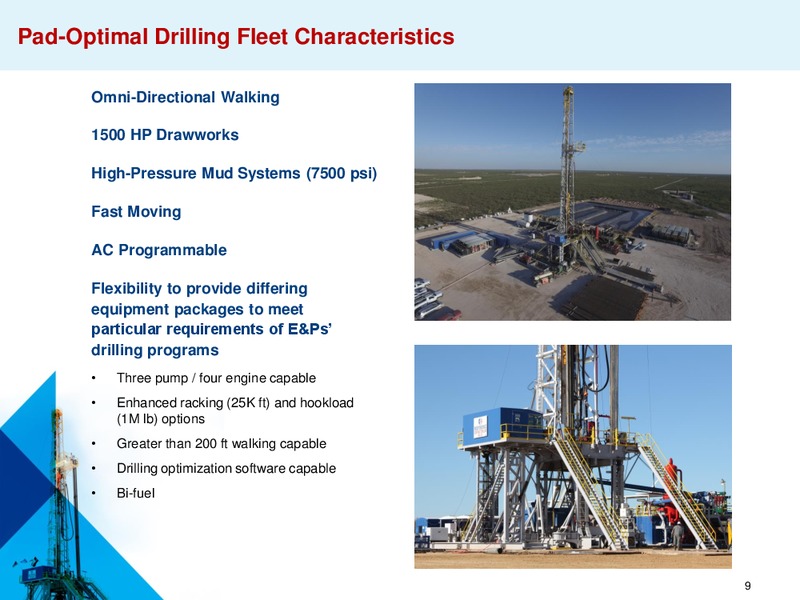
Pad-Optimal Drilling Fleet Characteristics Omni-Directional Walking 1500 HP Drawworks High-Pressure Mud Systems (7500 psi) Fast Moving AC Programmable Flexibility to provide differing equipment packages to meet particular…
Meaningful Player in Consolidating Pad-Optimal Market Market Share ICD Target Markets TX & 1,200 Operating Rigs(1) Contiguous States Operating Rigs Pad-Optimal & Upgradeable (1)(2) 1,000 800 600 ICD 400 PDS HP 200…
Drivers Towards Returns / Free Cash Flow Through Oil and Gas Cycle Operational and Financial Post combination integration substantially complete 6/30/19 Synergies from Sidewinder Expect realization of runrate synergies of 10 million+…
Synergy Realization Driving Overhead Efficiencies SG&A Expense as a % of Revenue 14% 12% Full realization of strategic combination 10% synergies expected 3Q19 8% 6% 4% 2% 0% ICD 3Q'18: Pre-SW ICD 4Q'18 Other…
Attractive Free Cash Flow Generation Free cash flow grows organically through the following opportunities: 120,000 Indicative Organic Growth Opportunities(1) Repricing of older legacy contracts 100,000 to current market day rates…
Free Cash Flow Generation Across the Entire Cycle In an oil and gas environment in 140,000 Indicative Adjusted EBITDA which oil prices are range bound 000s between 50 bbl and 70 bbl, ICD 120,000 is structured to generate free cash…
M&A Opportunities Sidewinder combination illustrates Pad-optimal / upgradeable operating rigs in ICD how consolidating transactions target markets of Texas and contiguous states owned by private or public drilling contractors with…
Financial Liquidity 130 million term loan Financial Liquidity Five-year term millions No amortization At December 31, 2018 Additional 15 million delayed- Cash 12.2 draw availability Minimal financial covenants Undrawn Revolver(1)…
Closing Summary Maintaining a Pad-Optimal drilling fleetwhile increasing Returns and Free Cash Flow by focusing on operational excellence and executable high-return internal Growth opportunities High-quality pad-optimal drilling…
18
Balance Sheet December 31, 2018 December 31, 2017 Assets Cash and cash equivalents 12,247 2,533 Accounts receivable, net 41,987 18,056 Inventories 2,693 2,710 Assets held for sale 19,711 4,637 Prepaid expenses and other current…
Income Statement Three Months Ended Twelve Months Ended December 31, September 30, December 31, 2018 2017 2018 2018 2017 Revenues 62,789 25,041 28,439 142,609 90,007 Costs and expenses Operating costs 39,908 18,780 18,420…
Non-GAAP Financial Measures Adjusted net income and loss, EBITDA and adjusted EBITDA are supplemental non-GAAP financial measure that are used by management and external users of our financial statements, such as industry analysts,…
Non-GAAP Financial Measures Reconciliation of Net Loss to Adjusted Net Loss: (Unaudited) (Unaudited) Three Months Ended Twelve Months Ended December 31, December 31, September 30, December 31, December 31, 2018 2017 2018 2018 2017…
Non-GAAP Financial Measures In the fourth quarter of 2018, we recorded insurance recoveries, net of impairments of 0.6 million on the Galayda facility water damage incurred during Hurricane Harvey after receiving a proof of loss…
Non-GAAP Financial Measures Three Months Ended Twelve Months Ended December 31, December 31, September 30, December 31, December 31, 2018 2017 2018 2018 2017 Number of marketed rigs end of period (1) 32 14 15 32 14 Rig operating…
 Loading...