Meeting proceedings Rich Kruger Chairman, President and CEO Ian Laing Corporate Secretary Imperial 2019 7
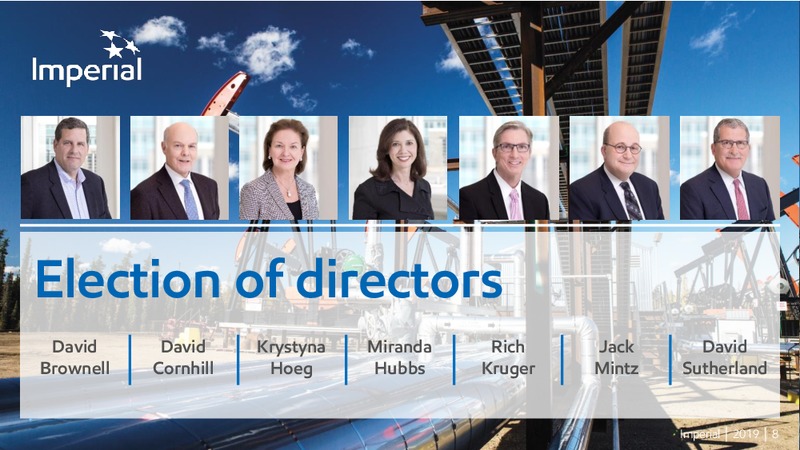
Election of directors David David Krystyna Miranda Rich Jack David Brownell Cornhill Hoeg Hubbs Kruger Mintz Sutherland Imperial 2019 8
Shareholder proposals Rich Kruger Chairman, President and CEO Ian Laing Corporate Secretary Imperial 2019 9
Chairmans remarks Rich Kruger Chairman, President and CEO Imperial 2019 10
Global energy outlook Energy demand to increase 25% by 2040, oil and gas to remain key Liquids production, mbd 120 100 Population and economic growth drive demand New production 80 All practical and economic energy sources…
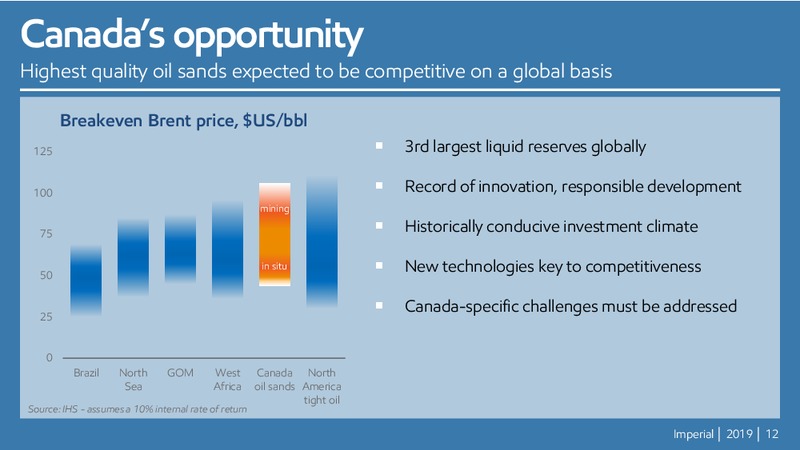
Canadas opportunity Highest quality oil sands expected to be competitive on a global basis Breakeven Brent price, US/bbl 125 3rd largest liquid reserves globally 100 Record of innovation, responsible development mining 75…
Imperials operations High quality, integrated, balanced, coast-to-coast asset portfolio Kearl mining F&L marketing Distribution network Syncrude mining Strathcona refinery Sarnia refinery Cold Lake in situ Sarnia chemical…
Imperials business model Deliver superior, long-term shareholder value Long-life, competitively advantaged assets Disciplined investment and cost management Value chain integration and synergies High-impact technologies and…
Risk management Comprehensive management of full spectrum of enterprise risks Strategic Reputational Safety Systematic approach in all areas Fundamental line management responsibility Financial Enterprise Risk Health and and…
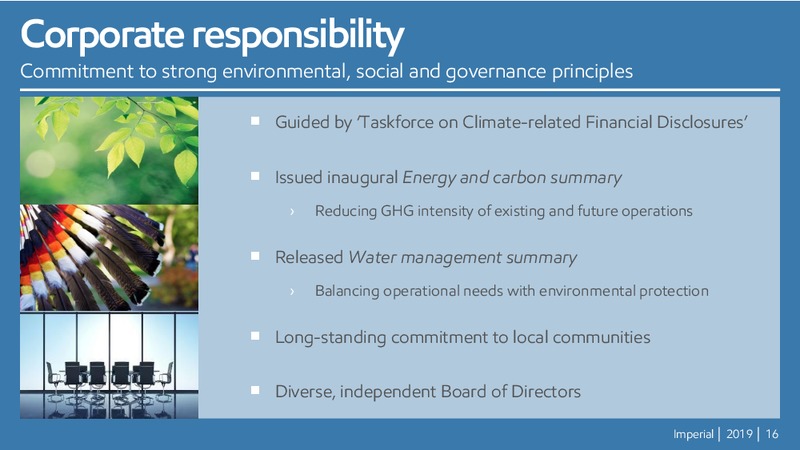
Corporate responsibility Commitment to strong environmental, social and governance principles Guided by Taskforce on Climate-related Financial Disclosures Issued inaugural Energy and carbon summary Reducing GHG intensity of existing…
Safety Industry leading performance and commitment to Nobody Gets Hurt TRIR, incidents per 200,000 hours worked 0.8 0.6 0.4 0.2 0.0 Husky CNRL Cenovus Suncor Imperial 5-year avg. Most recent Source: Company reports -…
2018 results Focused on strengthening performance and returning value to shareholders 383,000 boepd 2,314 million Upstream production Net income 392,000 bpd 3,922 million Refinery throughput Cash from operations 504,000 bpd…
Upstream assets 5.3 billion cash generated from operating activities over the last 5 years Production, koebd Kearl Mining - PFT 400 71% interest 300 Kearl Other Syncrude Mining - upgrader 200 25% interest Syncrude 100 Cold…
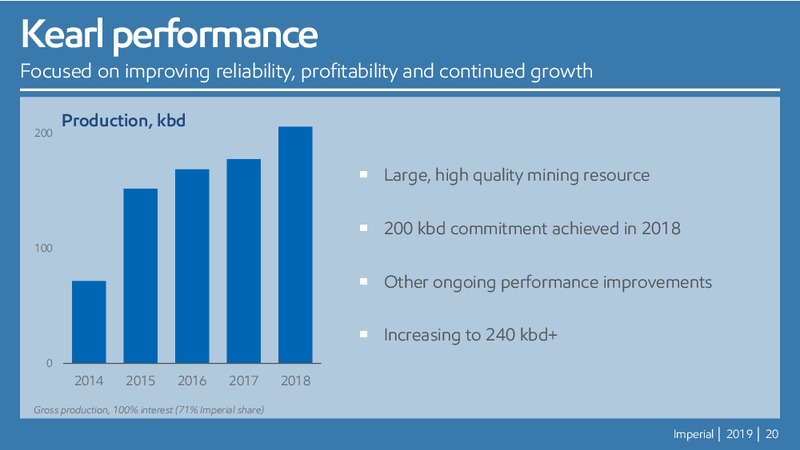
Kearl performance Focused on improving reliability, profitability and continued growth Production, kbd 200 Large, high quality mining resource 200 kbd commitment achieved in 2018 100 Other ongoing performance improvements…
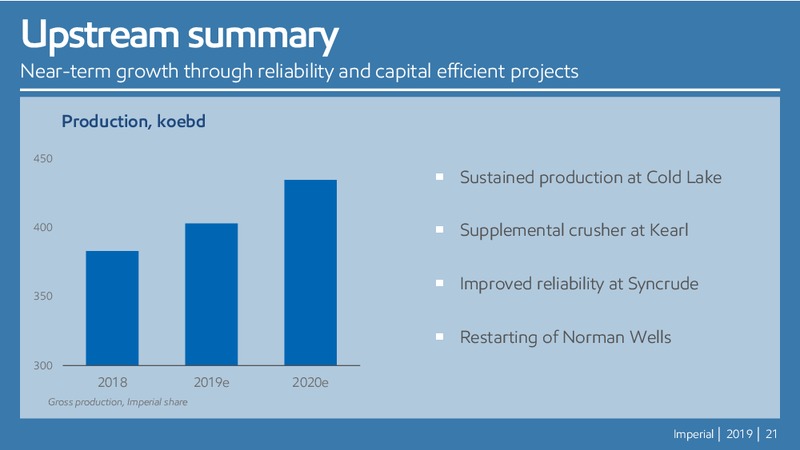
Upstream summary Near-term growth through reliability and capital efficient projects Production, koebd 450 Sustained production at Cold Lake 400 Supplemental crusher at Kearl Improved reliability at Syncrude 350 Restarting of…
Upstream growth potential Technology-enabled economic and environmental advancements Kearl Aspen Large portfolio of quality opportunities Syncrude Fort McMurray Chard Focused on in situ developments Corner Clyden CL Expansion…
Downstream overview 9.1 billion in cash flow generated from operating activities over the last 5 years Volumes, kbd Strathcona refinery 191 kbd capacity 500 Petroleum product sales 400 Sarnia refinery 119 kbd capacity 300…
Retail sales Captured 1 market position in 2018, driven by site growth Branded sites, 2000 1500 1000 2014 2015 2016 2017 2018 Retail market share source: The Kent Group Ltd. Imperial 2019 24
Commercial sales Targeted growth in high value aviation and asphalt segments Sales, kbd 50 Increased fuel sales into major airports 40 Market leader in growing segment 30 Over 50% of Ontario market 20 Asphalt projects to…
Downstream summary Positioned for continued industry leading financial and operating performance High performing refineries Scale, integration and logistics Advantaged feedstocks High value sales growth Premium brand…
Cash flow Integration resiliency, 33 billion cash from operations over last 10 years Cash from operating activities, B 10-year average, % 5-year range 5 Max 4 3 Downstream Upstream & Chemical 2 Min 1 0 10-year…
Financial strength Unmatched balance sheet, optionality and priority access to financial markets YE 2018 debt-to-capital, % 50 Maintain existing assets 25 Pay reliable and growing dividend Invest in high value projects 0…
Shareholder distributions 2.5 billion returned through dividends and share purchases in 2018 Dividend per share, 0.80 100+ years of uninterrupted dividend payment 24 consecutive years of growth 0.60 8.7% 5-year compound annual…
2019 Q1 results Continued focus on enhancing financial and operating performance 388,000 boepd 293 million Upstream production Net income 383,000 bpd 1.0 billion Refinery throughput Cash from operations 477,000 bpd 510 million…
Why Imperial Distinct competitive advantages that deliver long-term shareholder value Asset base Growth opportunities High quality, long-life assets across Large inventory of opportunities to the portfolio support future upstream…
Scrutineers report Ian Laing Corporate Secretary Imperial 2019 33
 Loading...