4Q 2018 Earnings Presentation – Exterran Corporation
Exterran Corporation ·
Feb 26, 2019 · 19 slides
Investor presentation from the Shale Experts oil & gas presentation and slide database . Every page is imaged and its text indexed for search across operators, plays, basins and time.
Slides
Financial Highlights EBITDA, as adjusted(1) for 4Q18 of $51.5 million, with EBITDA, as adjusted margin of 15% © 2019 Exterran Corporation. All rights reserved. 3 Book to bill within Product Sales was 1.3x for full year 2018 driven by…
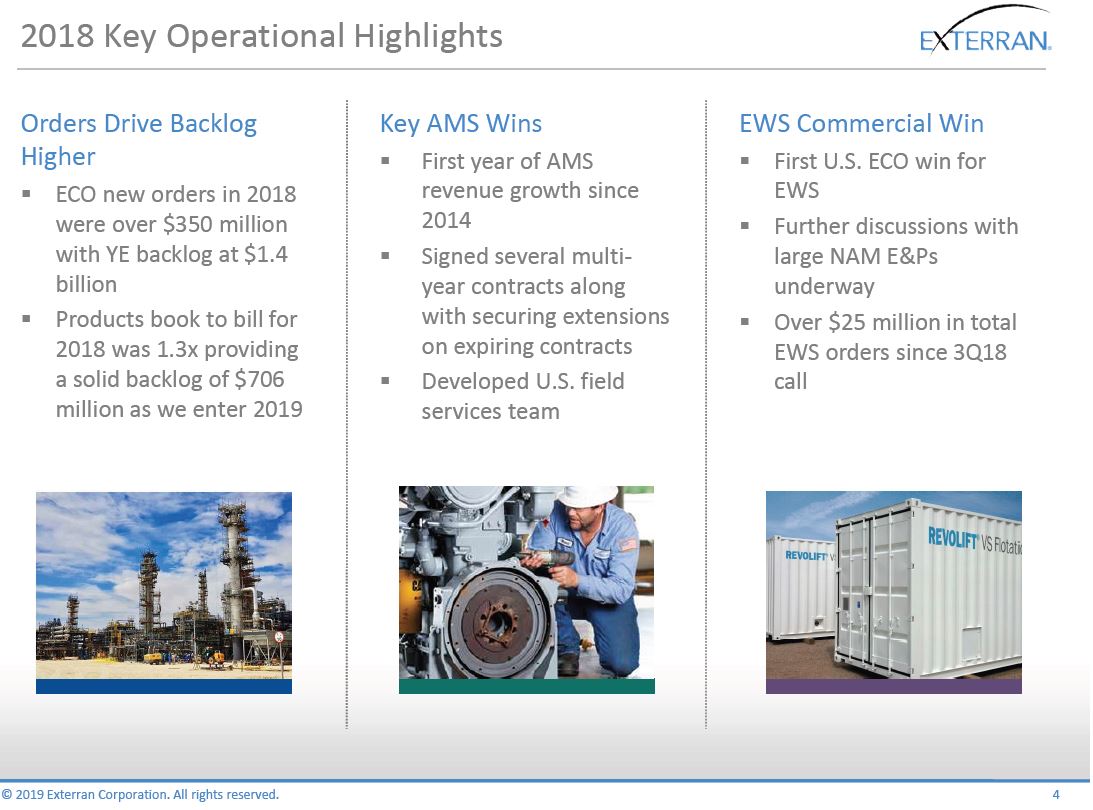
2018 Key Operational Highlights Orders Drive Backlog Higher ? ECO new orders in 2018 were over $350 million with YE backlog at $1.4 billion ? Products book to bill for 2018 was 1.3x providing a solid backlog of $706 million as…
4Q 2018 Revenue Mix Revenue by Segment North America 57% Latin America 21% Middle East and Africa 19% Asia Pacific 3% Revenue by Geomarket Revenue by Geomarket 3Q 2018 4Q 2018 Seq ? 4Q 2017 YoY ? North America $215 $190 -12%…
2019 Strategic Priorities Execute large ECO wins and grow ECO backlog Build out North American service business Scale our EWS business globally Drive new product development to create differentiation Produce strong free cash flow…
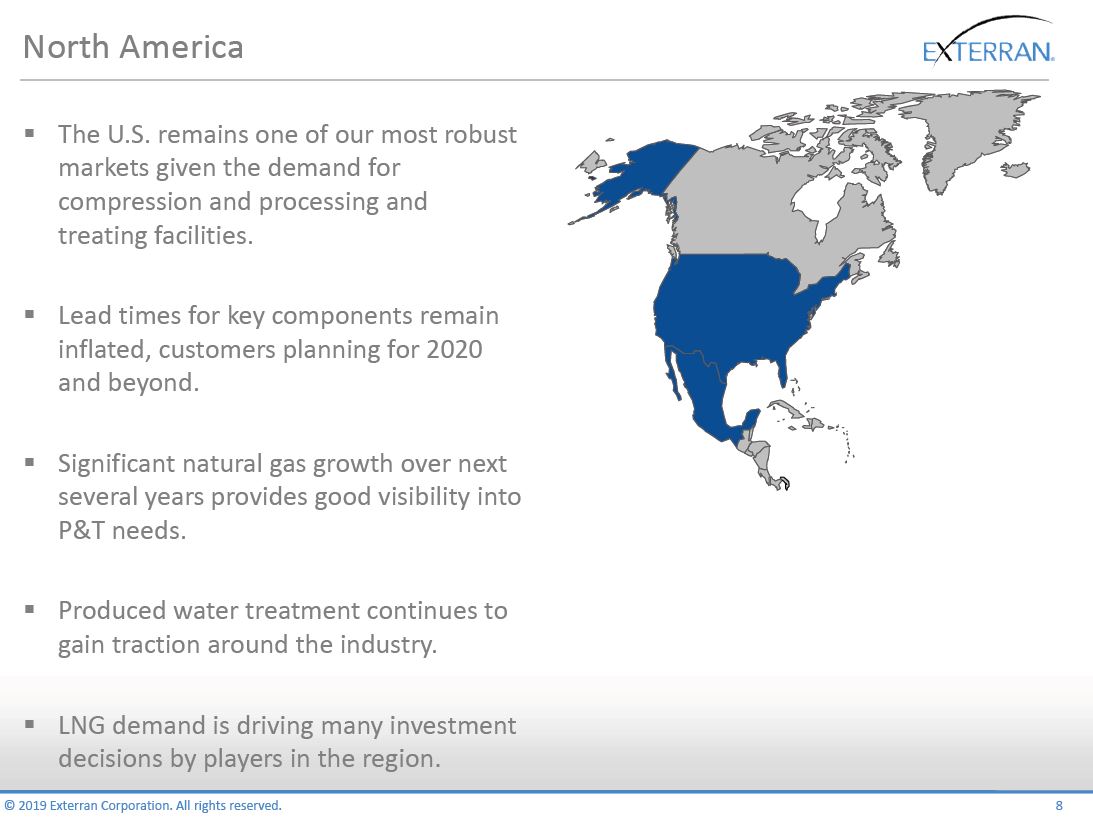
North America © 2019 Exterran Corporation. All rights reserved. 8 ? The U.S. remains one of our most robust markets given the demand for compression and processing and treating facilities. ? Lead times for key components remain…
Latin America © 2019 Exterran Corporation. All rights reserved. 9 ? Argentina - Vaca Muerta continuing momentum with additional opportunities to put assets to work in the country. ? Brazil – IOC investments are a leading indicator…
Middle East/Africa © 2019 Exterran Corporation. All rights reserved. 10 ? Robust region for EXTN with the largest capital growth opportunities internationally. ? Oman – demand across product lines strong, including EWS. ? Kuwait –…
Asia Pacific © 2019 Exterran Corporation. All rights reserved. 11 ? FPSO market is showing signs of resurgence. ? Regional expertise is an advantage in upcoming AMS opportunities, specifically around FPSO upgrades. ? LNG demand in…
Exterran Contract Operations (ECO) © 2019 Exterran Corporation. All rights reserved. 13 ? Revenue was up 4% sequentially while margin rate was up 255 bps ? Margin rate increase driven by productivity gains and commercial negotiations…
Aftermarket Services (AMS) © 2019 Exterran Corporation. All rights reserved. 14 ? Revenue was up 7% sequentially while margin rate declined 397 bps ? Commercial wins drove revenue increase while mix of parts sales contributed to…
Product Sales © 2019 Exterran Corporation. All rights reserved. 15 ? Revenue was down 4% with margin rate down 190 bps ? Negative mix and orders timing drove revenue and margin declines ? Bookings for the quarter were $159 million,…
Debt and Liquidity © 2019 Exterran Corporation. All rights reserved. 16 Capital Discipline Focused on Driving Shareholder Value $35 $375 2019 2020 2021 2022 2023 2024 2025 Debt Maturity Schedule ($MM) ? Revolving Credit Facility…
1Q 2019 Outlook © 2019 Exterran Corporation. All rights reserved. 17 Focusing on Oil, Gas, Water And Power Continued Operational Focus to Drive Solid Results 1Q19 Contract Operations 1Q19 Aftermarket 1Q19 Product Sales ? Revenue…
Non-GAAP Financial Measures © 2019 Exterran Corporation. All rights reserved. 20 EBITDA, as adjusted and EBITDA, as adjusted Margin Reconciliation ($ in thousands) Q4-18 Net income $ 14,073 Income from discontinued operations, net…
Non-GAAP Financial Measures © 2019 Exterran Corporation. All rights reserved. 21 Gross Margin Reconciliation ($ in thousands) Q4-2017 Q3-2018 Q4-2018 Income before income taxes $ 5,165 $ 11,150 $ 11,092 Selling, general and…
 Loading...