Mine to Wellsite Solutions May 2019 Investor Presentation May 7, 2019 0
Who is Smart Sand Overview Reserve Locations Oakdale, WI 1,256 acres (Monroe County, WI) Fully integrated provider of high quality Hixton, WI 959 acres 81% Finer Mesh Reserve Northern White frac sand. (Jackson County, WI) (40/70,…
Why is Smart Sand Different Its a one-stop shop Smart Sands Business Offerings Premium Northern White Reserve Gigantic Rail Capacity Terminal & Forward Staging Management Last Mile Logistics Wellsite Storage Solutions Large…
Product and Service Quality Matter Long Term Feedback from our customer base: Delivering high quality proppant to the wellhead in the large volumes needed Reliable long-term production from their wells Costboth long-term and…
Proppant Characteristics Matter West Texas (WTX) Sand is a lower quality proppant vs. Northern White Lower Crush Strength: Crushing of proppant creates fines, these fines will migrate and pack rearrangement occurs Fines decrease…
Proppant Strength Matters (WTX vs. Northern White) A significant DELTA exists between Northern White and Texas Permian Sand. Source: Management elaboration on independent studies. 7
Mining and Production 8
Oakdale Facility: High Quality Northern White Raw Frac Sand in an Efficient Configuration 9
Byron Transload: Provides Optionality on Rail Delivery 10
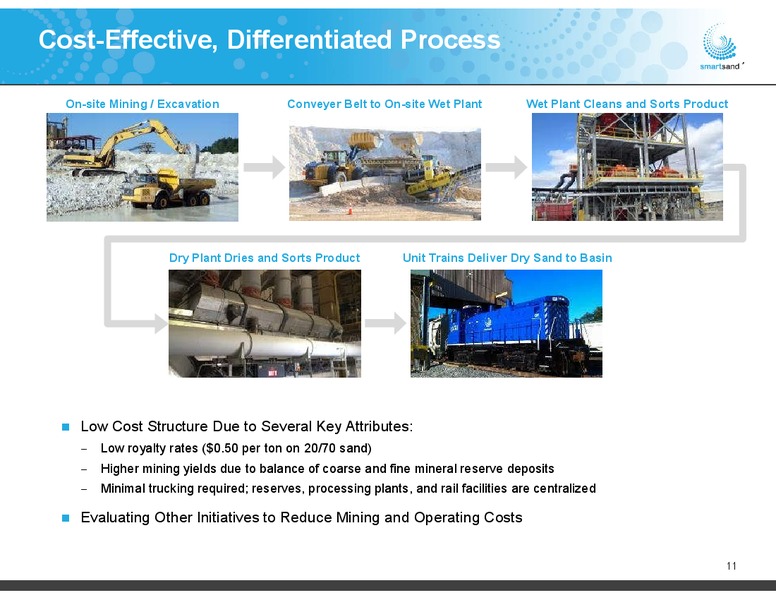
Cost-Effective, Differentiated Process On-site Mining / Excavation Conveyer Belt to On-site Wet Plant Wet Plant Cleans and Sorts Product Dry Plant Dries and Sorts Product Unit Trains Deliver Dry Sand to Basin Low Cost…
Logistics and Wellsite Solutions 12
Expansive Logistics Capabilities Key Logistical Advantages Highly Competitive Delivery Capabilities Dual Served Class I Rail Access onsite service on Canadian Pacific rail line coupled with nearby terminal on Union Pacific rail line…
Van Hook Terminal Location: Van Hook, ND Commenced operations in April 2018 Signed long-term take-or-pay contract with an anchor customer at in-basin pricing 15.5 million paid consideration We have shipped 590,000 tons through Van…
Wellsite Storage Solutions Features Transported using specialized trailer for unassisted setup in 5 minutes. Tri-axle trailer design with reinforced steel frame and remote control operation. Direct to blender delivery, controls…
System Layouts Flexible layout options as demonstrated below with our QS4400XR silo Single Blender Layout Dual Blender Layout 1,050 Ton 1,320 Ton Layout Layout 16
Our Wellsite Storage vs. the Competition Competitive Options Smart Sands Wellsite Storage Equipment Smart Sand: Silos: Multiple Size Options With Custom Belts Required, No Direct To Configurations Blender Offload Engineered…
Industry Overview 18
Industry Trends Continue to Support Increasing Use of Frac Sand per Well Horizontal well lateral lengths Proppant per lateral foot continues continue to get longer to increase Source: Spears and Associates 1Q 2019 Proppant…
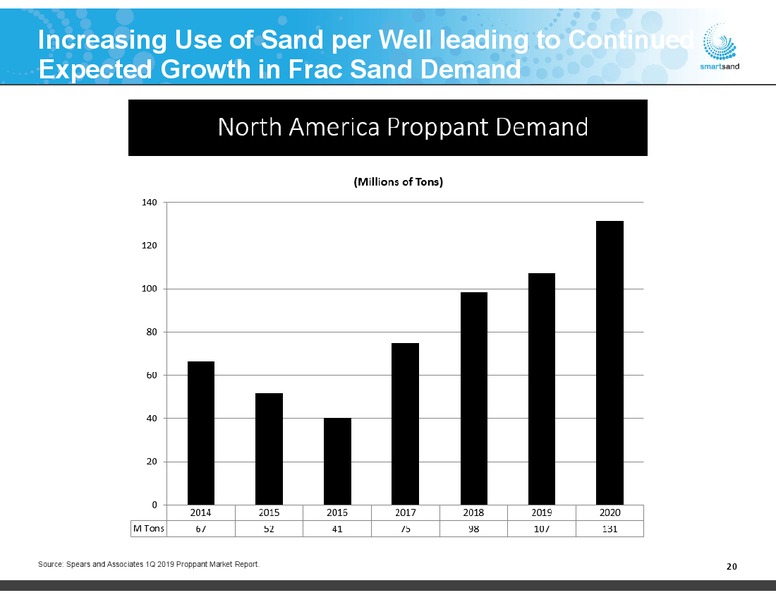
Increasing Use of Sand per Well leading to Continued Expected Growth in Frac Sand Demand Source: Spears and Associates 1Q 2019 Proppant Market Report. 20
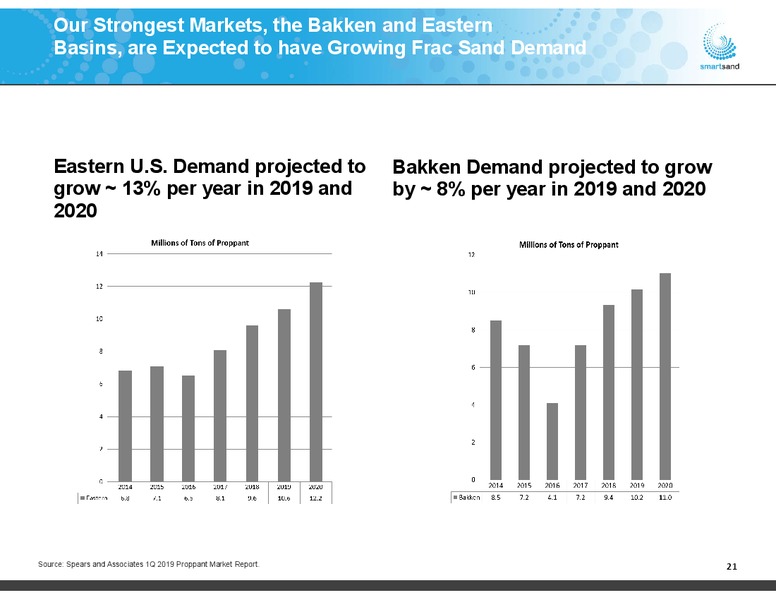
Our Strongest Markets, the Bakken and Eastern Basins, are Expected to have Growing Frac Sand Demand Eastern U.S. Demand projected to Bakken Demand projected to grow grow 13% per year in 2019 and by 8% per year in 2019 and 2020…
Finer Sand is the Standard Mesh Sizes Market Outlook for Fine Sand Proppant size is characterized by mesh size According to Kelrik LLC, a notable driver which is determined by sieving the proppant impacting demand for fine mesh sand…
Why Smart Sand A Full Service and Cost Effective One Stop Solution Large reserve base of high quality finer mesh Northern White Frac Large, efficient sand at Oakdale available to support market demand reserve base, Substantial…
Appendix 26
APPENDIX Committed to Highest Corporate Standards Management maintains close dialogue with customers regarding the oil and gas industrys rigorous regulatory environment Legal & ISO registered Quality System and Environmental…
APPENDIX Income Statement For the Year ended Year ended Year ended Three months ended Dec 31, 2016 Dec 31, 2017 Dec 31, 2018 Mar 31, 2019 ( in millions) (audited) (audited) (audited) (unaudited) (1,2) Revenues 59.2 137.2 212.5…
APPENDIX Balance Sheet As of Dec 31, 2016 Dec 31, 2017 Dec 31, 2018 Mar 31, 2019 ( in millions) (audited) (audited) (audited) (unaudited) Current assets Cash and cash equivalents 47.5 35.2 1.5 2.4 Accounts receivable 5.7 24.6…
APPENDIX Statement of Cash Flows Year ended Year ended Year ended Three months ended Dec 31, 2016 Dec 31, 2017 Dec 31, 2018 Mar 31, 2019 ( in millions) (audited) (audited) (audited) (unaudited) Operating activities Net income (loss)…
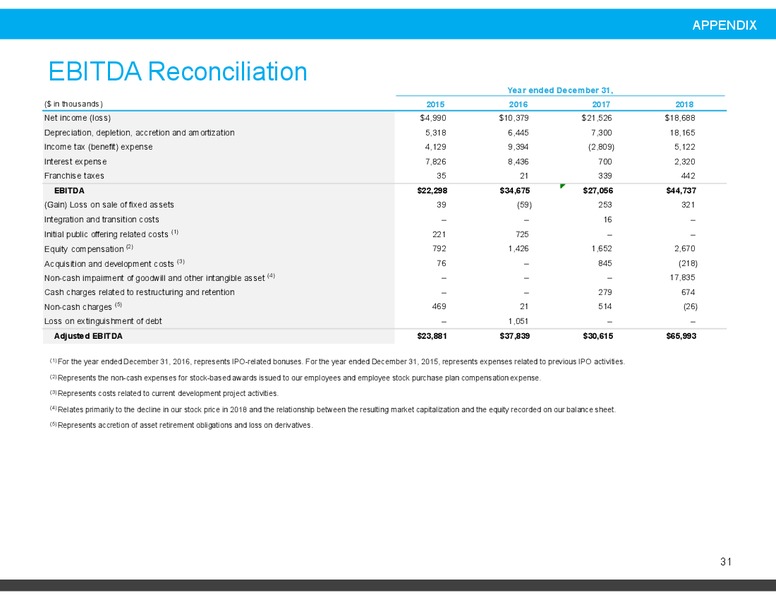
APPENDIX EBITDA Reconciliation Year ended December 31, ( in thousands) 2015 2016 2017 2018 Net income (loss) 4,990 10,379 21,526 18,688 Depreciation, depletion, accretion and amortization 5,318 6,445 7,300 18,165 Income tax (benefit)…
APPENDIX EBITDA Reconciliation Quarter ended ( in thousands) 3/31/2018 6/30/2018 9/30/2018 12/31/2018 3/31/2019 Net income (loss) 975 10,021 12,125 (4,433) 4,033 Depreciation, depletion, accretion and amortization 3,160 4,296 4,929…
APPENDIX Contribution Margin Reconciliation Quarter ended ( in thousands) 3/31/2018 6/30/2018 9/30/2018 12/31/2018 3/31/2019 Revenue 42,628 54,448 63,146 52,248 51,775 Cost of goods sold 35,413 34,678 40,595 34,217 40,605 Gross…
 Loading...