1Q 2019 Financial Performance Highlights Revenue Adjusted EBITDA 1Q19 revenues of 262 million, net income 494 of 28 million and adjusted EBITDA of 83 million(1) 1Q 2019 adjusted EBITDA margins were 32% 262 41% of revenue from…
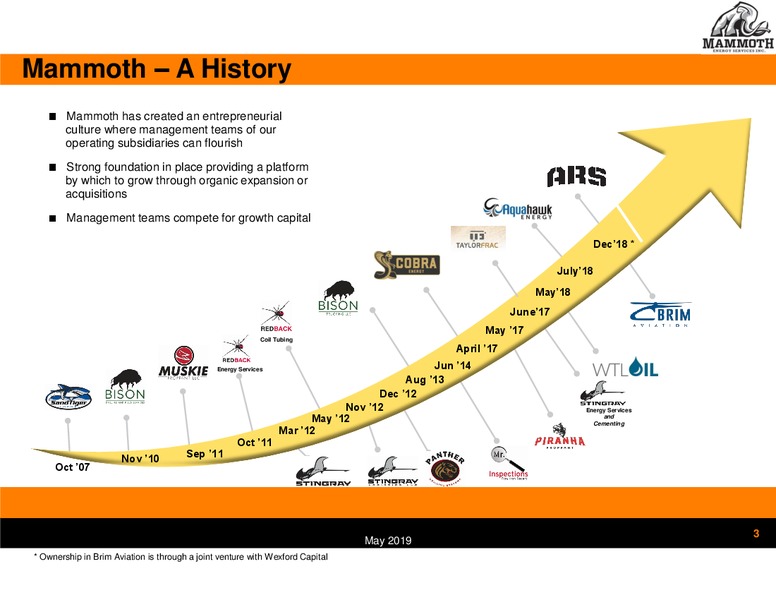
Mammoth A History Mammoth has created an entrepreneurial culture where management teams of our operating subsidiaries can flourish Strong foundation in place providing a platform by which to grow through organic expansion or…
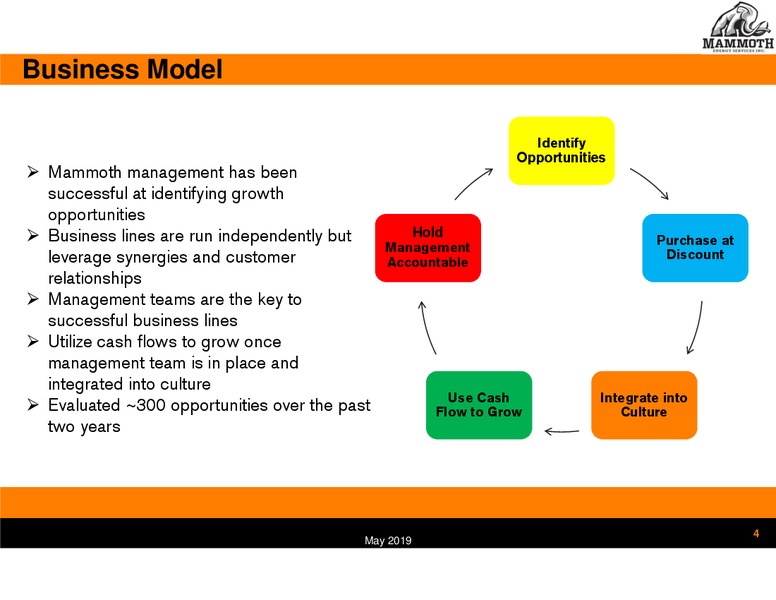
Business Model Identify Opportunities Mammoth management has been successful at identifying growth opportunities Business lines are run independently but Hold Purchase at Management leverage synergies and customer Accountable…
Corporate Strategy ENTREPRENEURIAL CULTURE INVEST IN ATTRACTIVE OPPORTUNITIES GROWTH: QUALITY OVER QUANITITY EXECUTION IS CRITICAL 5 May 2019
Focused on Returns After Tax ROIC (TTM)* Deploy capital to the highest returning projects Keep costs low Leverage corporate synergies Cross sell services through established 29% customer relationships 23% Search for well…
Two Primary Business Lines Infrastructure Services Oil Field Services Fully capable infrastructure construction services Fully integrated oil field services model incorporating the including the following: following services:…
Mammoth Metamorphosis Past (pre-2017) Present Future Pure Oilfield Service Energy Service Industrial Company Pressure pumping Infrastructure Construction Infrastructure Construction Natural proppant Transmission construction…
TUSK Well Positioned vs Peers EV / 2020 EBITDA (Consensus Estimates) (1)(2) 8.0x 6.8x 5.2x 5.5x Compelling value opportunity versus peers 4.1x 4.2x Trading at discount to peer group despite superior balance sheet and service…
2019 Capex Budget 2019 Major Projects Maintenance capital of 25 million 20 Growth capital will remain dependent on market conditions Organically growing the continental U.S. infrastructure business, 25 ultimately dependent on…
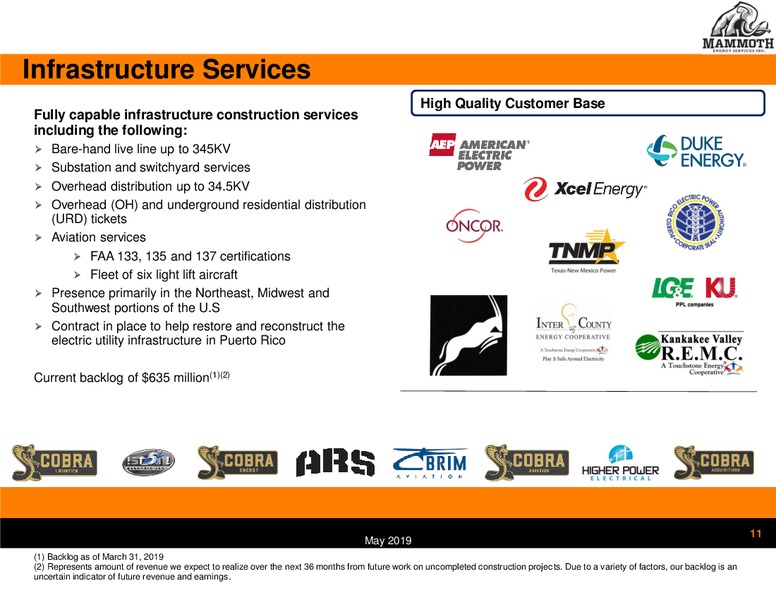
Infrastructure Services High Quality Customer Base Fully capable infrastructure construction services including the following: Bare-hand live line up to 345KV Substation and switchyard services Overhead distribution up to 34.5KV…
Oil Field Services Fully integrated Oil Field service offering High Quality Customer Base Six high pressure pumping fleets (50,000 Hhp each) Two high quality Northern White sand mines Total processing capacity of 4.4 Mmtpa Best in…
Adjusted EBITDA Reconciliation Three Months Three Months Reconciliation of Adjusted EBITDA to net income (000s) Ended Ended March 31, 2019 March 31, 2018 Net Income (Loss) 28,333 55,546 Depreciation, Depletion, Accretion and…
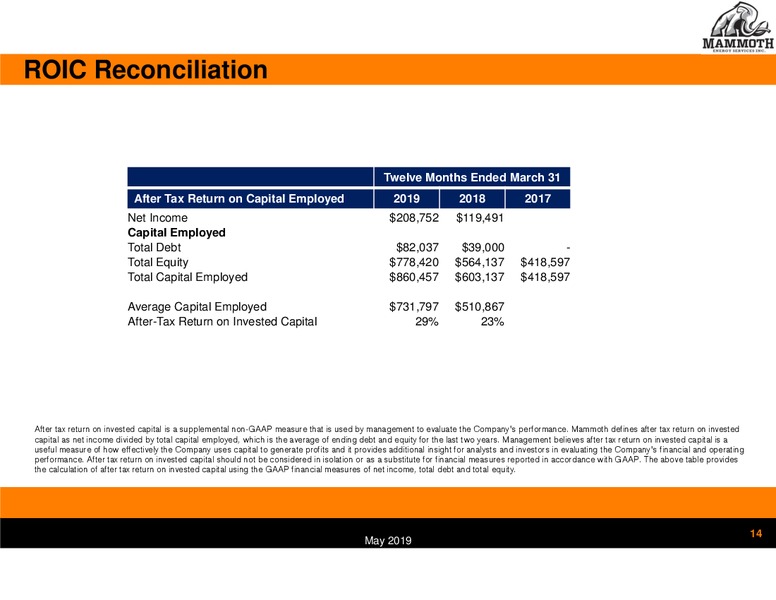
ROIC Reconciliation Twelve Months Ended March 31 After Tax Return on Capital Employed 2019 2018 2017 Net Income 208,752 119,491 Capital Employed Total Debt 82,037 39,000 - Total Equity 778,420 564,137 418,597 Total Capital…
Company Headquarters 14201 Caliber Drive, Suite 300 Oklahoma City, OK 73134 405-608-6007 investorsmammothenergy.com 15 May 2019
 Loading...