Corporate overview and operational highlights Page 2
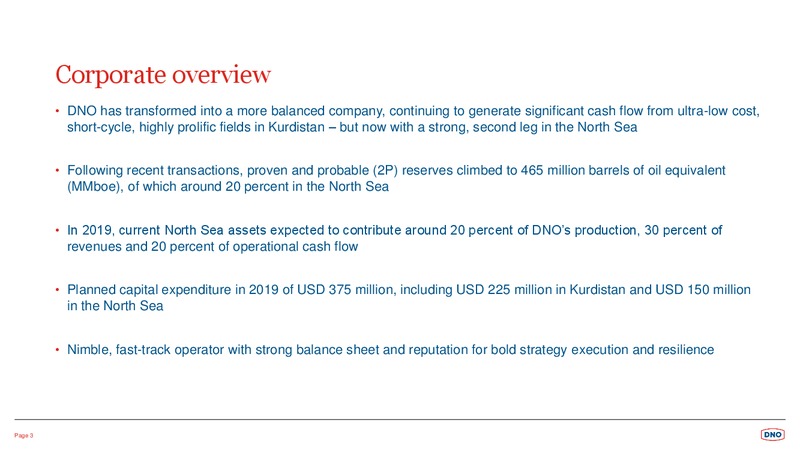
Corporate overview DNO has transformed into a more balanced company, continuing to generate significant cash flow from ultra-low cost, short-cycle, highly prolific fields in Kurdistan but now with a strong, second leg in the North…
Q1 2019 operational highlights Company Working Interest (CWI) production averaged 107,600 barrels of oil equivalent per day (boepd) in Q1 2019, up 36 percent from 79,100 boepd a year earlier in Q1 2018 Of which in Q1 2019, 89,400…
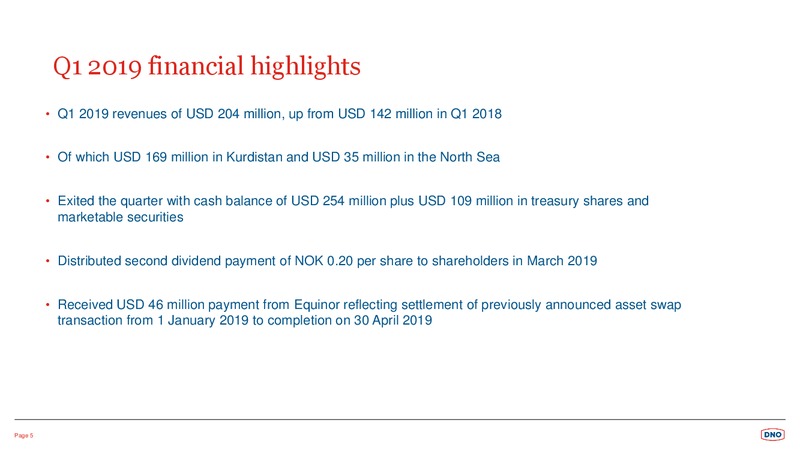
Q1 2019 financial highlights Q1 2019 revenues of USD 204 million, up from USD 142 million in Q1 2018 Of which USD 169 million in Kurdistan and USD 35 million in the North Sea Exited the quarter with cash balance of USD 254 million…
DNO driving Kurdistans oil sector ramp up Kurdistans security, financial and oil sector conditions have normalized and Kurdistan remains one of the most exciting onshore oil provinces anywhere Leading international operator in…
Fast-track growth strategy in Norway Completed acquisition of Faroe Petroleum plc and integration of teams and assets on track Faroe acquisition brings 18,000 boepd to DNO portfolio less than two years after re-entering the North…
Active 2019 program At USD 70 per barrel Brent price, expect revenues to exceed USD 1 billion, with the North Sea contributing around 30 percent of the total Active drilling program of 36 wells (25 development/infill and 11…
Investment program Annual operational spend USD million Capex Expex Lifting 900 800 680 700 600 500 400 293 300 259 200 125 100 0 2016 2017 2018 2019 (projected) Operational spend projected at USD 680 million in…
2019 capital and exploration expenditure outlook Planned capital expenditure in 2019 of USD 375 million, of 2019 forecast capex and expex USD million which USD 225 million in Kurdistan and USD 150 million in the North Sea 25 Around…
Q1 2019 cash flow USD million 800 58.1 97.8 700 600 500 428.5 400 729.1 300 6.5 200 254.4 100 0 Cash at end-2018 Cash from operations Investment activities Tax & finance Cash at end-Q1 2019 Funded Faroe…
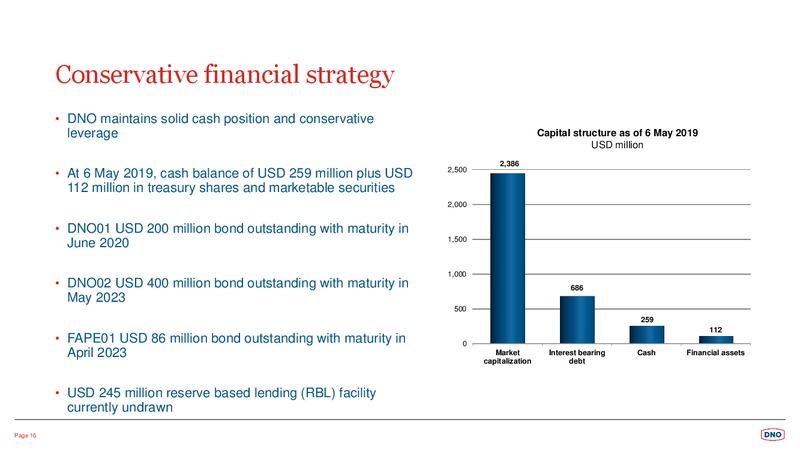
Conservative financial strategy DNO maintains solid cash position and conservative leverage Capital structure as of 6 May 2019 USD million 2,386 At 6 May 2019, cash balance of USD 259 million plus USD 2,500 112 million in treasury…
Important notice This presentation (the Presentation) has been prepared and delivered by DNO ASA (DNO or the Company). Copyright of all published material including photographs, drawings and images in this document remains vested in…
 Loading...