Agenda Highlights Financial results Contract status Outlook Summary 3
Recent highlights Q1 2019 High utilisation Utilisation of fully owned vessels in Q1 of 62.5% (33.3%) Financial results EBITDA before non-recurring items of USD 25.9 million (USD 24.1 million reported) Cash flow from operations…
Agenda Highlights Financial results Contract status Outlook Summary 5
Income statement High utilisation of fully owned vessels of 62.5% (Q1 (Unaudited figures in USD million) Q1 19 Q1 18 2018: 33.3%). Operating revenues 67 83 Lower operating revenues despite higher utilisation Operating expenses (43)…
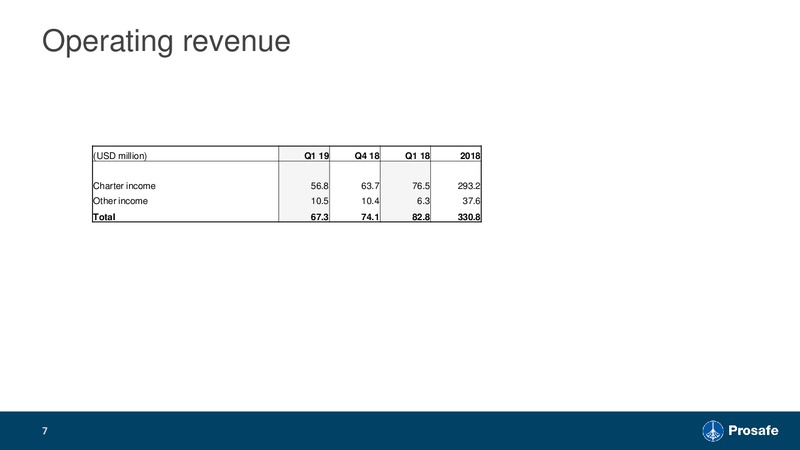
Operating revenue (USD million) Q1 19 Q4 18 Q1 18 2018 Charter income 56.8 63.7 76.5 293.2 Other income 10.5 10.4 6.3 37.6 Total 67.3 74.1 82.8 330.8 7
Balance sheet (Unaudited figures in USD million) 31.03.19 31.12.18 31.03.18 Total assets of ca. USD 1.7 billion Vessels 1,401 1,423 1,501 New builds 126 3 126 125 10 Reduced cash balance mainly due to further Other non-current assets…
Agenda Highlights Financial results Contract status Outlook Summary 9
Fleet status: Contracts, wins and extensions Contract backlog Contracting update Safe Boreas three of six one-month options exercised at the Mariner project in the UK sector of the North Sea. Operations presently through September…
Agenda Highlights Financial results Contract status Outlook Summary 11
12 10 20 30 40 50 60 70 80 90 0 100 jan 02, 2015 mar 02, 2015 mai 02, 2015 Dollars per barrel jul 02, 2015 Healthy oil price sep 02, 2015 nov 02, 2015 jan 02, 2016 mar 02, 2016 mai 02, 2016 jul 02,…
Global: Cashflow and sanctioning increase Record high cash flows for E&Ps in 2018 onwards Global offshore greenfield capex by sanctioning year Source: Rystad Energy 13
Status - Order backlog Firm backlog was USD 159 million per end Q1 2019 14
UKCS: 200 billion investment requirement In 2018, oil and gas accounted for 75 per cent of the UK's primary energy demand and the UK Government forecasts that it will still be required to meet around two-thirds of primary energy…
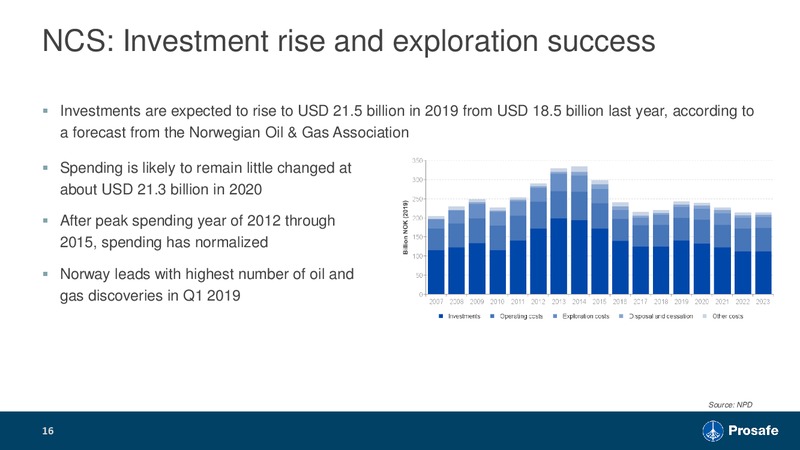
NCS: Investment rise and exploration success Investments are expected to rise to USD 21.5 billion in 2019 from USD 18.5 billion last year, according to a forecast from the Norwegian Oil & Gas Association Spending is likely to remain…
Brazil: High ambitions and tender activity ongoing IOC offshore spending increase Even upon conclusion of the tenders, contracted supply is considered insufficient to meet Petrobras near/ medium term demand Petrobras offshore MMO…
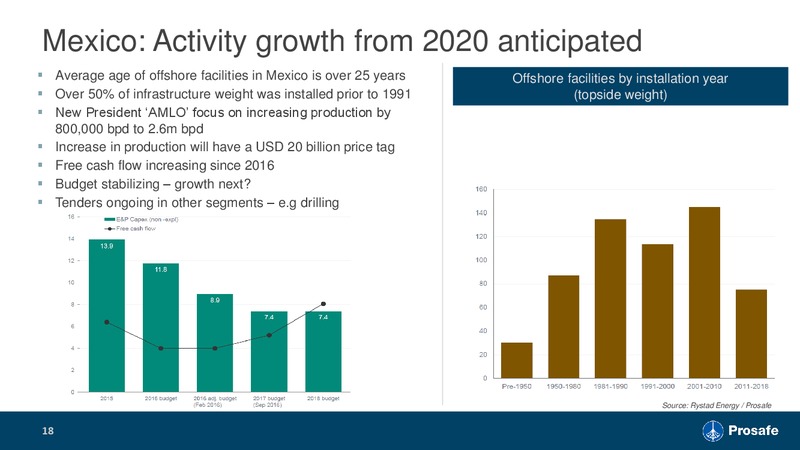
Mexico: Activity growth from 2020 anticipated Average age of offshore facilities in Mexico is over 25 years Offshore facilities by installation year Over 50% of infrastructure weight was installed prior to 1991 (topside weight) New…
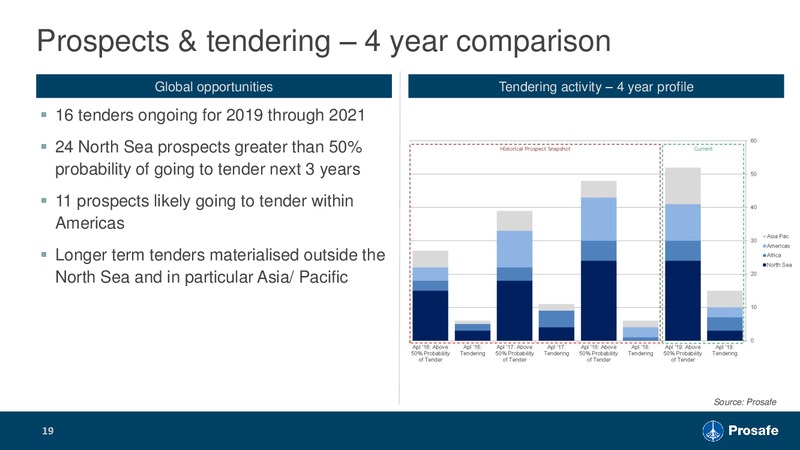
Prospects & tendering 4 year comparison Global opportunities Tendering activity 4 year profile 16 tenders ongoing for 2019 through 2021 24 North Sea prospects greater than 50% probability of going to tender next 3 years 11 prospects…
Agenda Highlights Financial results Contract status Outlook Summary 20
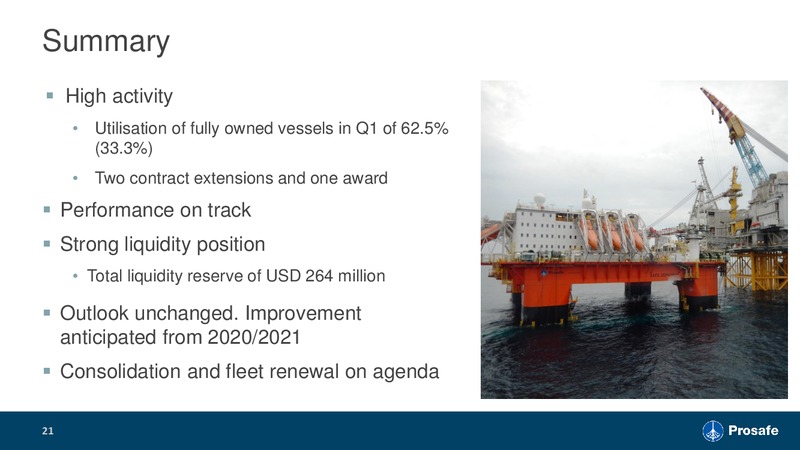
Summary High activity Utilisation of fully owned vessels in Q1 of 62.5% (33.3%) Two contract extensions and one award Performance on track Strong liquidity position Total liquidity reserve of USD 264 million Outlook unchanged.…
 Loading...