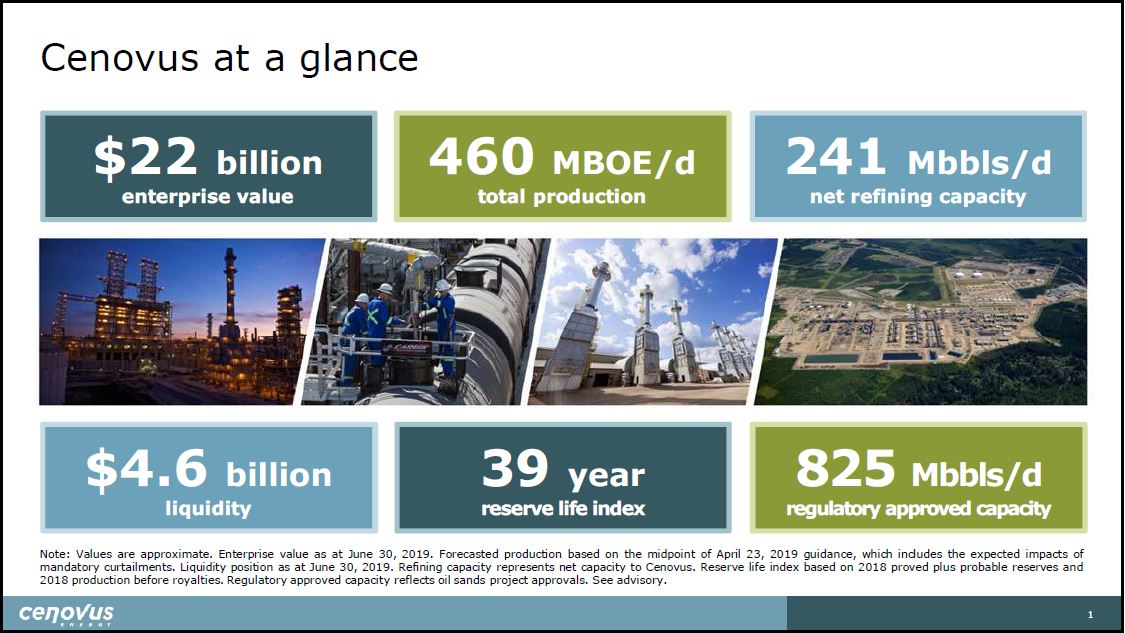
Cenovus at a glance $22 billion enterprise value 460 MBOE/d total production 241 Mbbls/d net refining capacity $4.6 billion liquidity 39 year reserve life index 825 Mbbls/d regulatory approved capacity Note: Values are…
Note: Values are approximate. Enterprise value as at June 30, 2019. Forecasted production based on the midpoint of April 23, 2019 guidance, which includes the expected impacts of mandatory curtailments. Liquidity position as at June 30,…
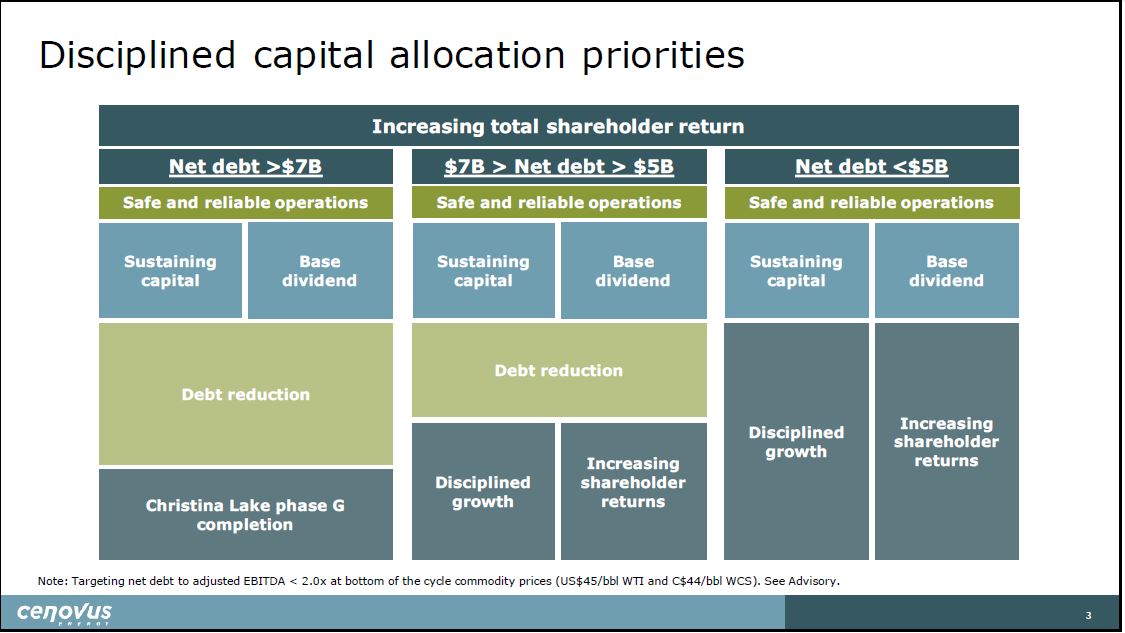
Disciplined capital allocation priorities Sustaining capital Christina Lake phase G completion Increasing total shareholder return Note: Targeting net debt to adjusted EBITDA < 2.0x at bottom of the cycle commodity prices (US$45/bbl…
Managing the balance sheet for the bottom of the cycle Net and gross debt reduction $ billions Manageable long-term maturities • Reduced total debt by US$2.1 billion or 28% since Q3 2018 • Partial redemption of 2019 bond in Q4 2018…
Largest SAGD producer with best-in-class assets • oil sands sustaining…
Best-in-class oil sands assets Note: Values are approximate. Forecasted production based on the midpoint of April 23, 2019 guidance, which includes the expected impacts of mandatory curtailment. Proved plus probable bitumen reserves as…
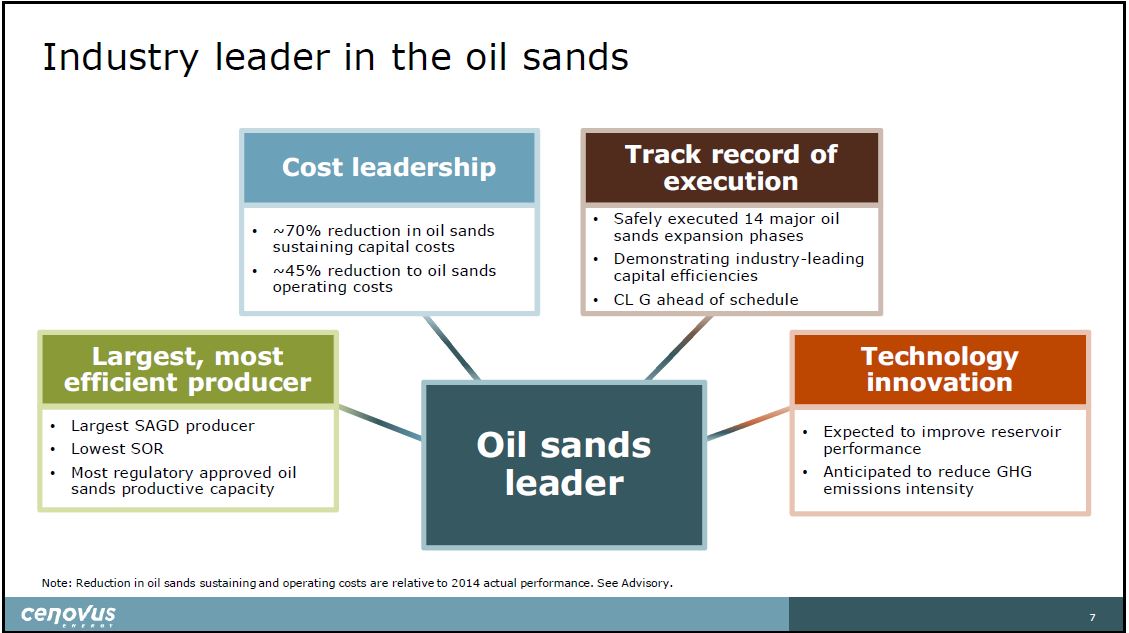
Oil Sand leader • Expected to improve reservoir performance • Anticipated to reduce GHG emissions intensity Largest, most efficient producer • Largest SAGD producer • Lowest SOR • Most regulatory approved oil sands productive…
Best-in-class producing assets with unmatched scale of operation • Concentrated resources with significant reserve life • Safely executed 14 major oil sands capacity expansions • SOR reflects resource quality and execution • Lower SOR…
Sustainable reductions to oil sands cost structure Oil sands sustaining capital costs Oil sands operating costs $0.00 $3.00 $6.00 $9.00 $12.00 $15.00 2014 2015 2016 2017 2018 $/bbl • ~ 45% reduction to oil sands opex since 2014…
Industry-leading capital efficiencies drive future growth Note: Cenovus has flexibility on start-up and will take into consideration whether mandated curtailments have been lifted and if there is sustained improvement in market access…
Demonstrating cost leadership in the oil sands Source: Company reports. Peers include ATH, CNQ, HSE, MEG, and SU. 2018 oil sands sustaining capital costs per barrel $/bbl CVE 2019F Q1 2019 oil sands operating costs per barrel…
Track record of execution with significant running room Note: Cenovus has flexibility on start-up of Christina Lake phase G and will take into consideration whether mandated curtailments have been lifted and if there is sustained…
Direct GHG emissions intensity Tonnes CO2e / m3OE Note: Fresh water (non-saline) is defined as water with less than 4,000 ppm Total Dissolved Solid (TDS) and may still contain other natural contaminants which make it unsuitable for…
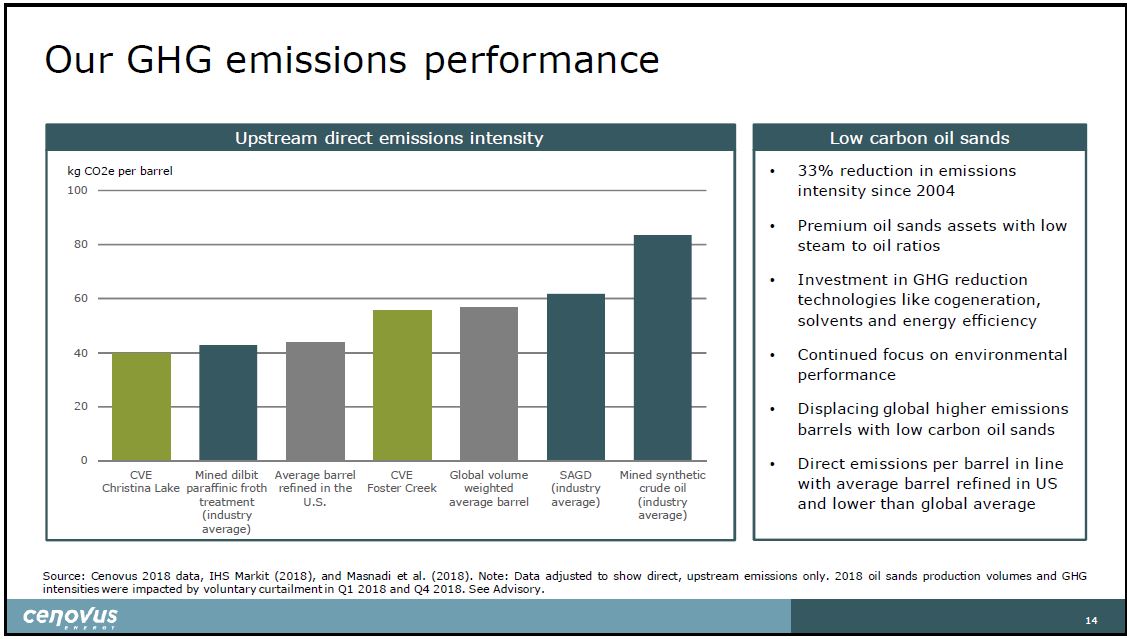
Our GHG emissions performance Upstream direct emissions intensity kg CO2e per barrel Source: Cenovus 2018 data, IHS Markit (2018), and Masnadi et al. (2018). Note: Data adjusted to show direct, upstream emissions only. 2018 oil sands…
Solvents expected to create value and reduce emissions intensity Note: Expectations of solvent are associated with conventional solvent aided process (CSAP). • Decreases SOR by ~30% - 35% • Increases individual well production rates…
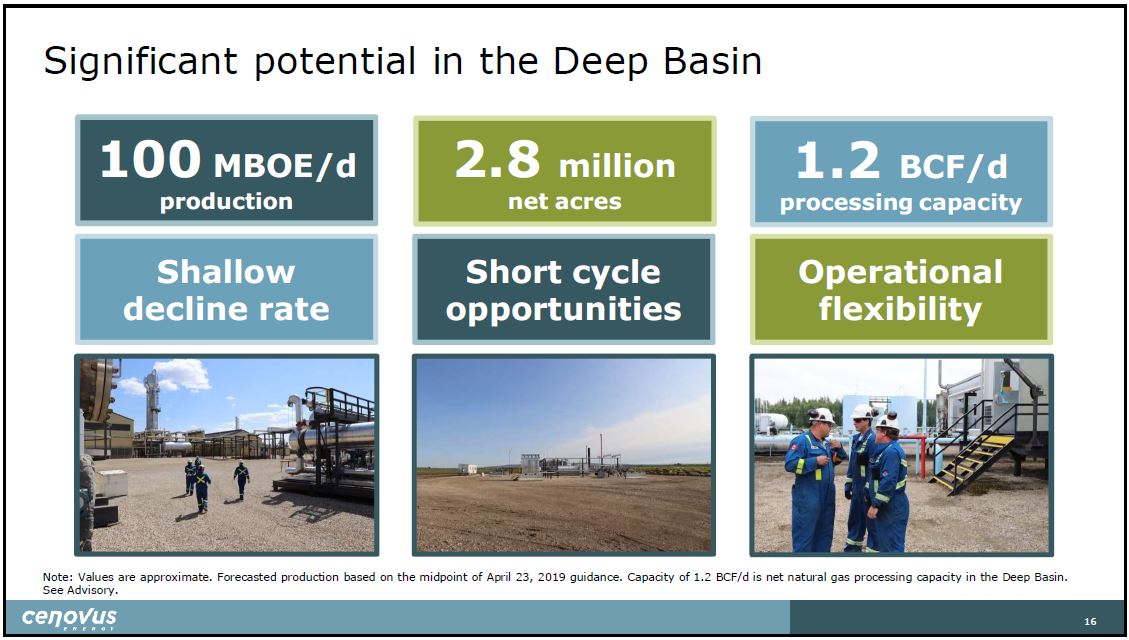
Significant potential in the Deep Basin Note: Values are approximate. Forecasted production based on the midpoint of April 23, 2019 guidance. Capacity of 1.2 BCF/d is net natural gas processing capacity in the Deep Basin. See Advisory.…
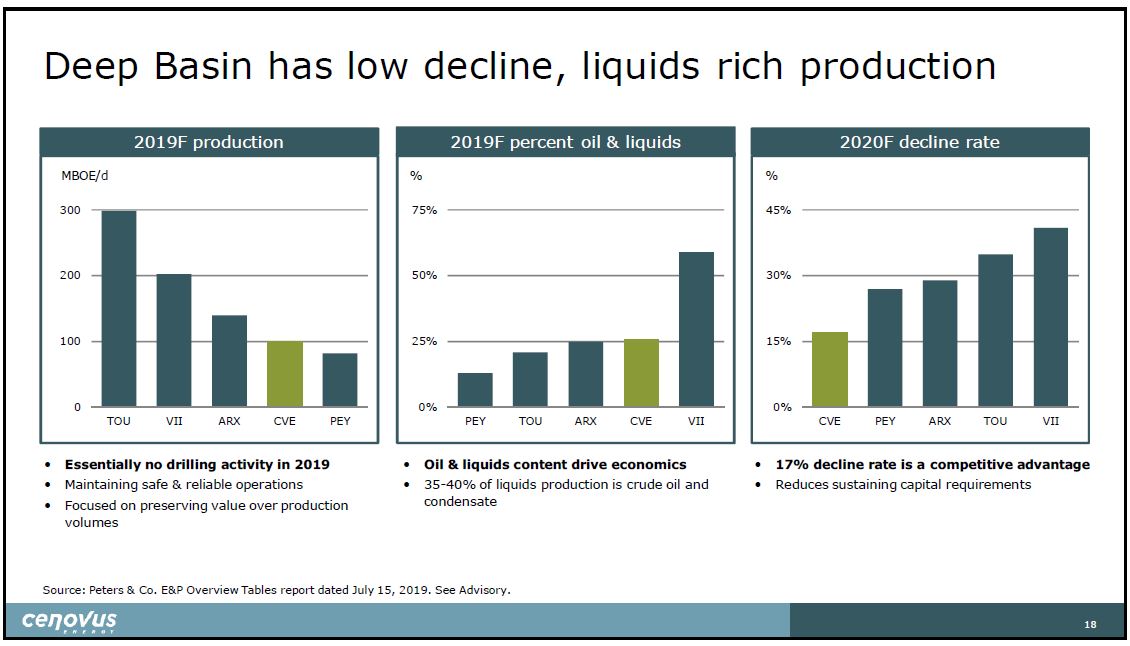
Deep Basin provides short-cycle opportunities • Three core operating areas across approximately 2.8 million net acres • 2019F production: 95 – 105 MBOE/d (26% liquids; 17% decline rate) • Disciplined capital investment in 2019 of $50 –…
Deep Basin has low decline, liquids rich production 2019F production 2020F decline rate 0 100 200 300 TOU VII ARX CVE PEY MBOE/d • 17% decline rate is a competitive advantage • Reduces sustaining capital requirements •…
Additional development upside at Marten Hills Note: See Advisory. Cenovus Deep Basin Lands Cenovus Oil Sands Lands Athabasca Oil Sands Region Cenovus Marten Hills Lands 2019 activity focused on further appraisal across land base…
Integration across the value chain improves margin Heavy processing capacity Current ex- Alberta pipeline commitments Crude by rail capacity 128 Mbbls/d 118 Mbbls/d 100 Mbbls/d Note: Values are approximate, net to Cenovus,…
Benefiting from refinery location and processing capacity Note: Capacities are gross values. Cenovus is a 50 percent partner in the Wood River and Borger refineries, operated by our partner, Phillips 66. See advisory. Heavy oil…
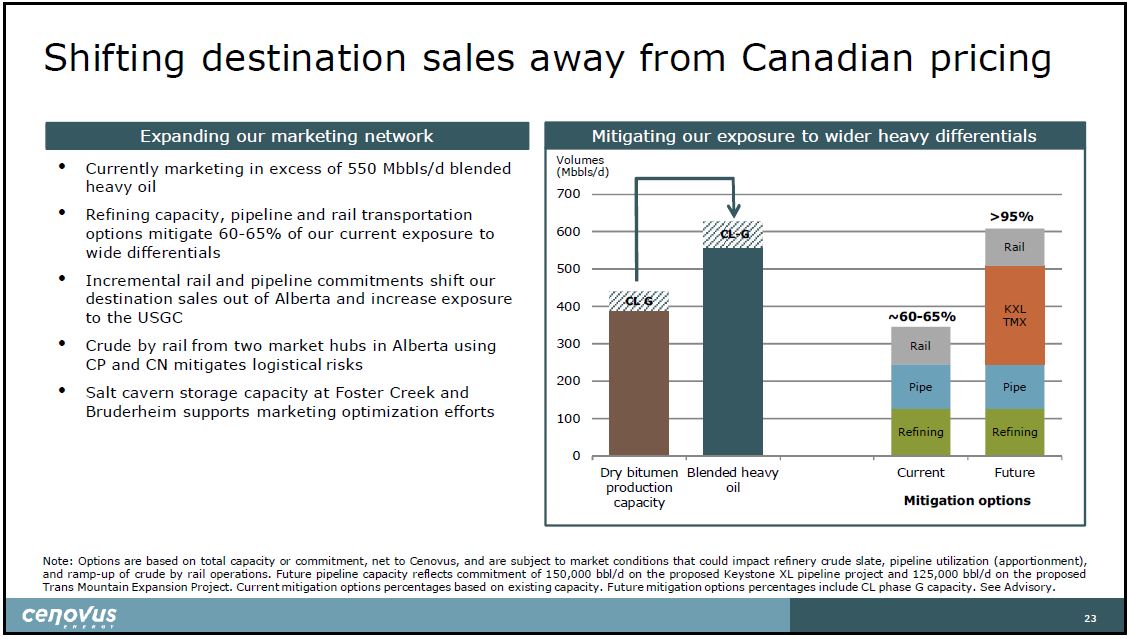
Refining capacity mitigates heavy oil differentials • Refining assets help to mitigate exposure to wider light-heavy differentials • Approximately 25% of total blended heavy oil volumes are mitigated with processing capacity • Wood…
Shifting destination sales away from Canadian pricing Mitigating our exposure to wider heavy differentials Volumes (Mbbls/d) >95% Note: Options are based on total capacity or commitment, net to Cenovus, and are subject to market…
Crude by rail provides structural support and optionality Total U.S. destination crude by rail sales Ramp-up drives margin improvement Total US crude by rail sales (Mbbls/d) • Crude by rail is a structural part of our portfolio…
Pipelines are core to market access strategy • Taking a portfolio approach to maximize the value of every barrel • Secured pipeline access to key markets outside of Alberta • Multiple pipelines provide diversification of markets and…
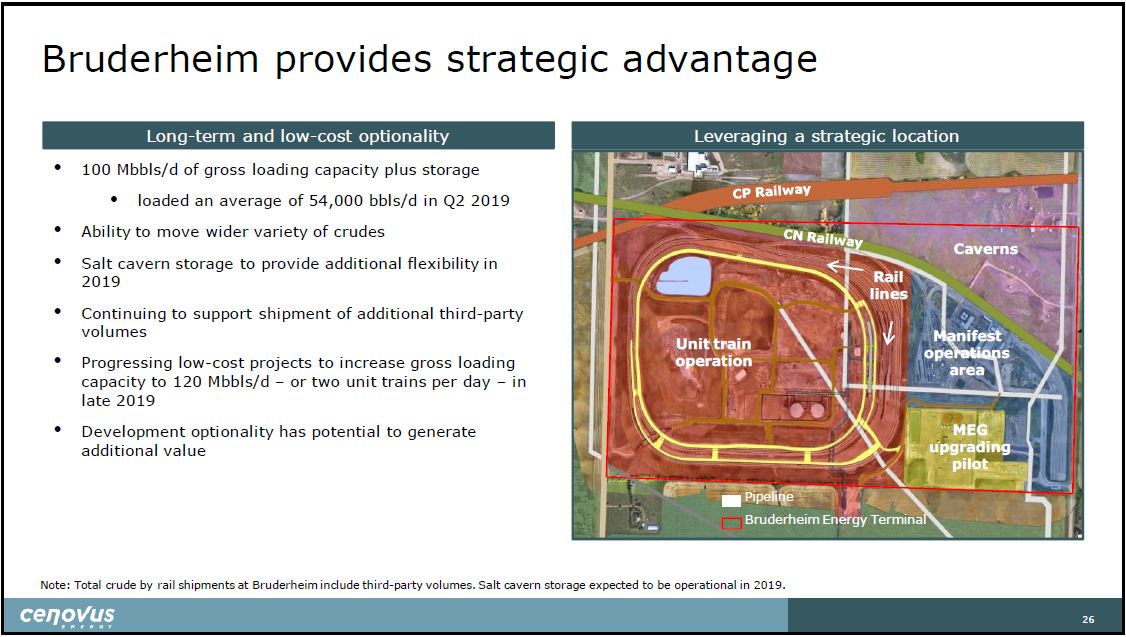
Bruderheim provides strategic advantage MEG upgrading pilot Manifest operations area Unit train operation Rail lines Bruderheim Energy Terminal Pipeline Caverns Note: Total crude by rail shipments at Bruderheim include…
Creating value through corporate responsibility • SERR Committee of the Board provides oversight of environment and sustainability performance • Enterprise Risk Management program, practices, and policy help ensure active and…
Supplemental
Current productive capacity phases A-G (bbls/d) 180,000 Regulatory approved capacity (bbls/d) 295,000 Reservoir depth ~450 meters Net pay 25 – 30 meters High permeability 5 – 10 darcies High oil saturation ~80% API bitumen 9° – 11°…
Phase Phase B A Phase C Phase D Optimization CDE Phase F Phase E Christina Lake production history Successfully executed 7 SAGD expansions and optimizations Current productive capacity phases A-F (bbls/d) 210,000…
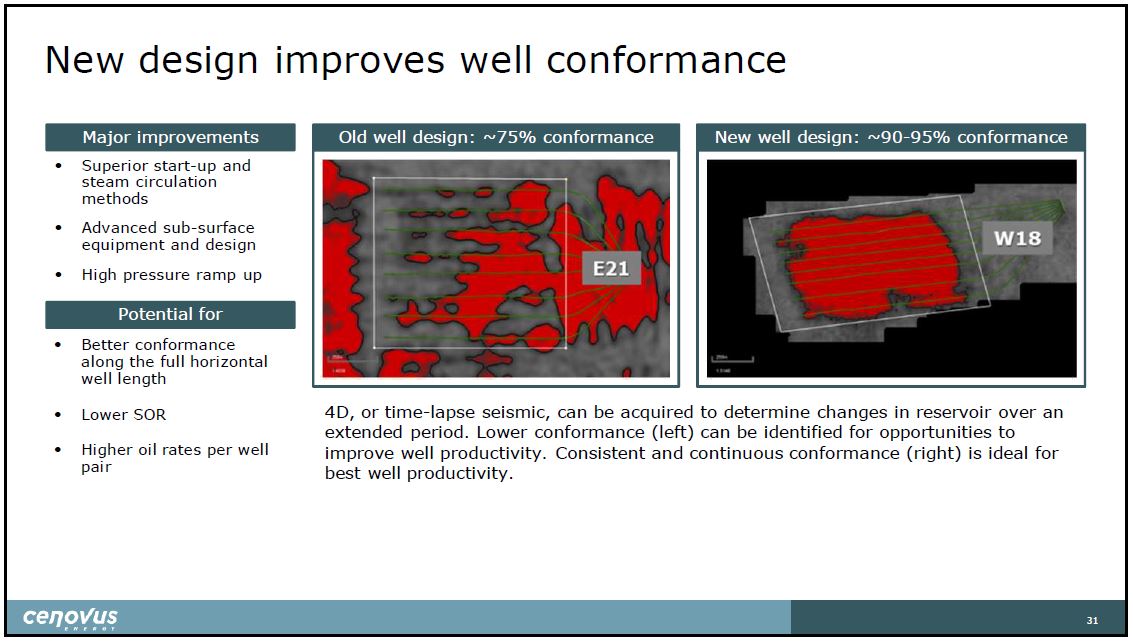
New design improves well conformance • Superior start-up and steam circulation methods • Advanced sub-surface equipment and design • High pressure ramp up 31 2011 4D, or time-lapse seismic, can be acquired to determine changes in…
Improved start-up procedures on new pads Improved performance Foster Creek well performance improving • Longer reach horizontal well pairs Recovery factor • Drilling improvements • Inflow/outflow control devices • Improved start-up…
500 1,000 1,500 2,000 2,500 3,000 3,500 1 31 61 91 121 151 181 211 241 271 301 331 361 391 421 Day Average 1,400m well Average 965m well Christina Lake H09 pad – 6 well pairs at 1,600m H-09 p • Improved conformance allows us…
Redesigned well pads drive cost improvements Sustainable reductions in oil sands capital Transaction Redesigned well pias dfu allty C fhinraisntcinead Lake • Improved modular and scalable design for well pairs and pads • Materially…
Foster Creek estimated capital savings of $500 million After: • 8 pads • 66 wells • ~$600 million • 220 MMbbls recoverable Before: • 18 pads • 120 wells • ~$1.1 billion • 200 MMbbls recoverable Improved conformance, longer…
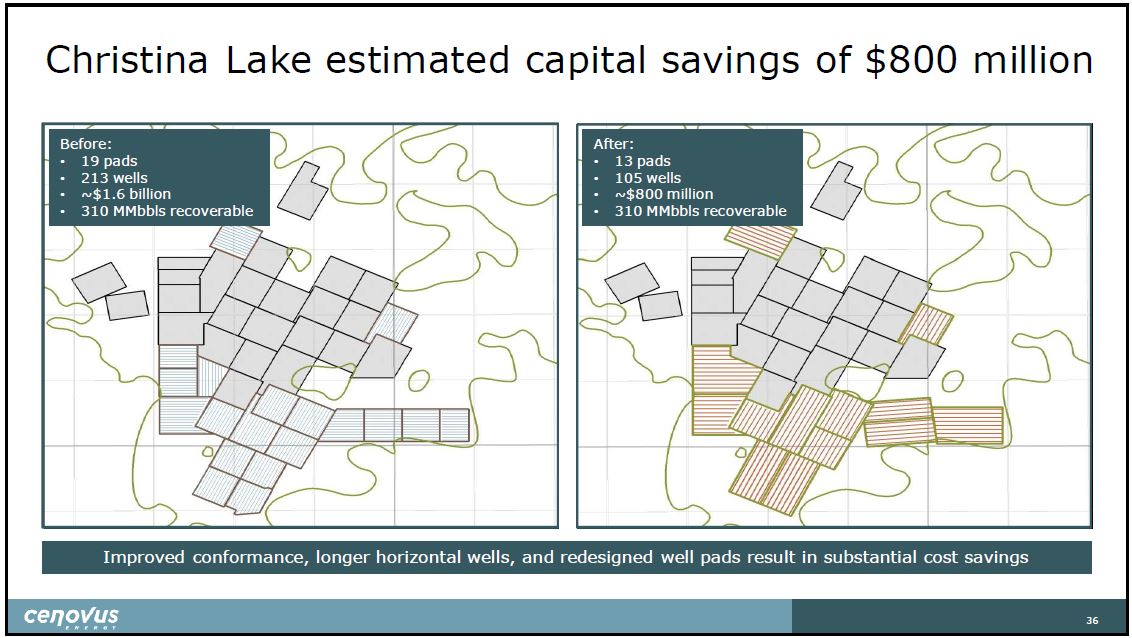
Christina Lake estimated capital savings of $800 million Before: • 19 pads • 213 wells • ~$1.6 billion • 310 MMbbls recoverable After: • 13 pads • 105 wells • ~$800 million • 310 MMbbls recoverable Improved conformance, longer…
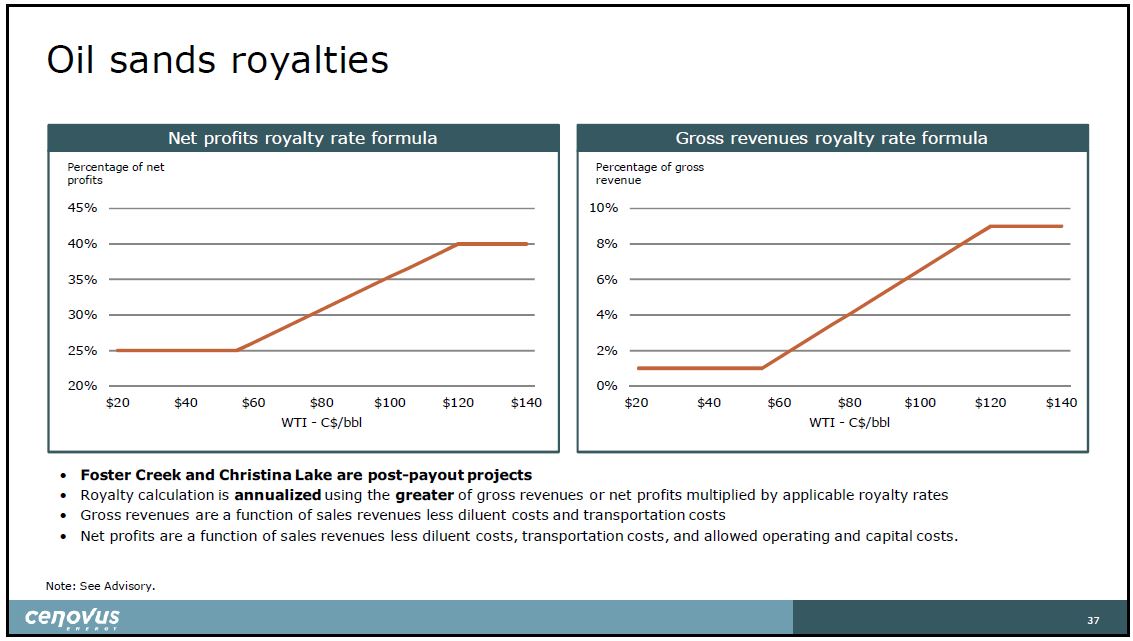
Foster Creek and Christina Lake are post-payout projects • Royalty calculation is annualized using the greater of gross revenues or net profits multiplied by applicable royalty rates • Gross revenues are a function of sales revenues…
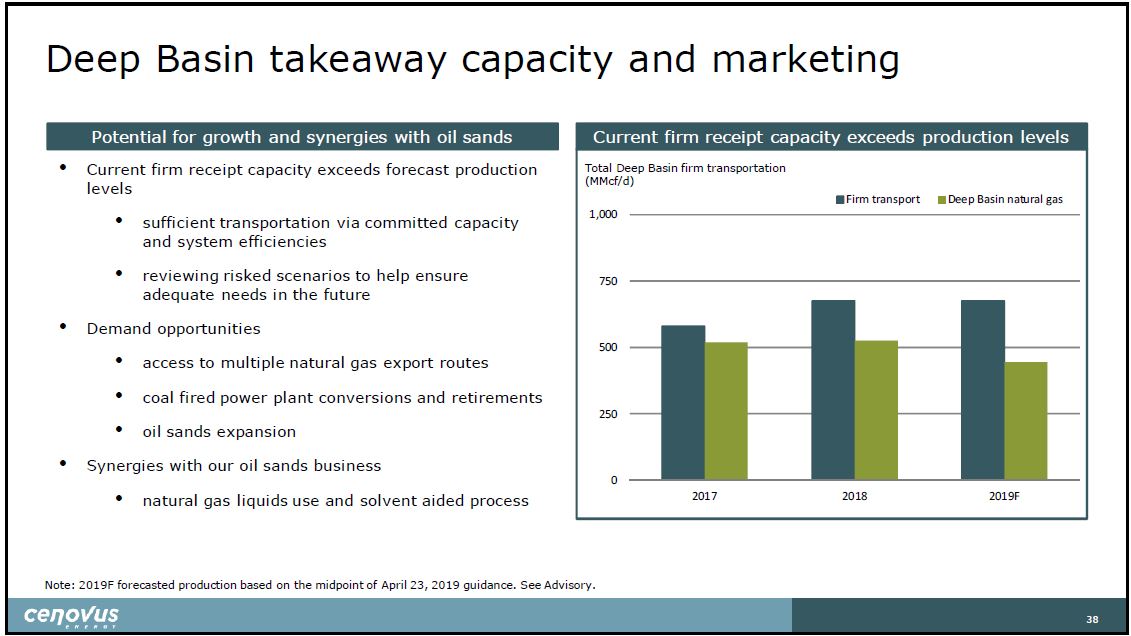
Deep Basin takeaway capacity and marketing Potential for growth and synergies with oil sands Current firm receipt capacity exceeds production levels • Current firm receipt capacity exceeds forecast production levels • sufficient…
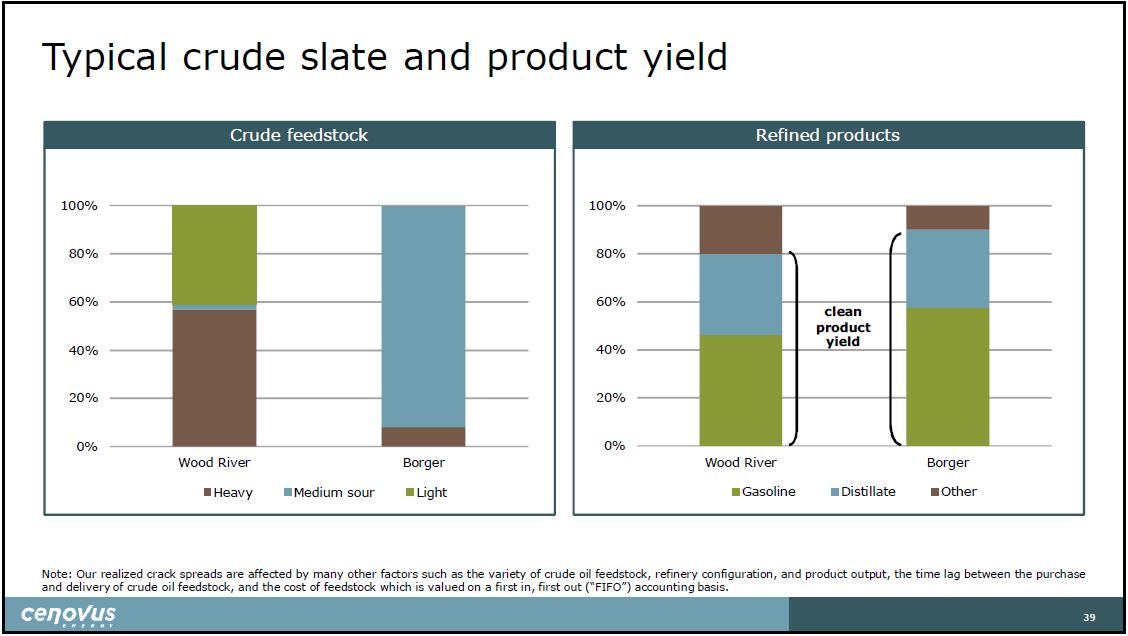
Typical crude slate and product yield Crude feedstock Refined products Note: Our realized crack spreads are affected by many other factors such as the variety of crude oil feedstock, refinery configuration, and product output, the time…
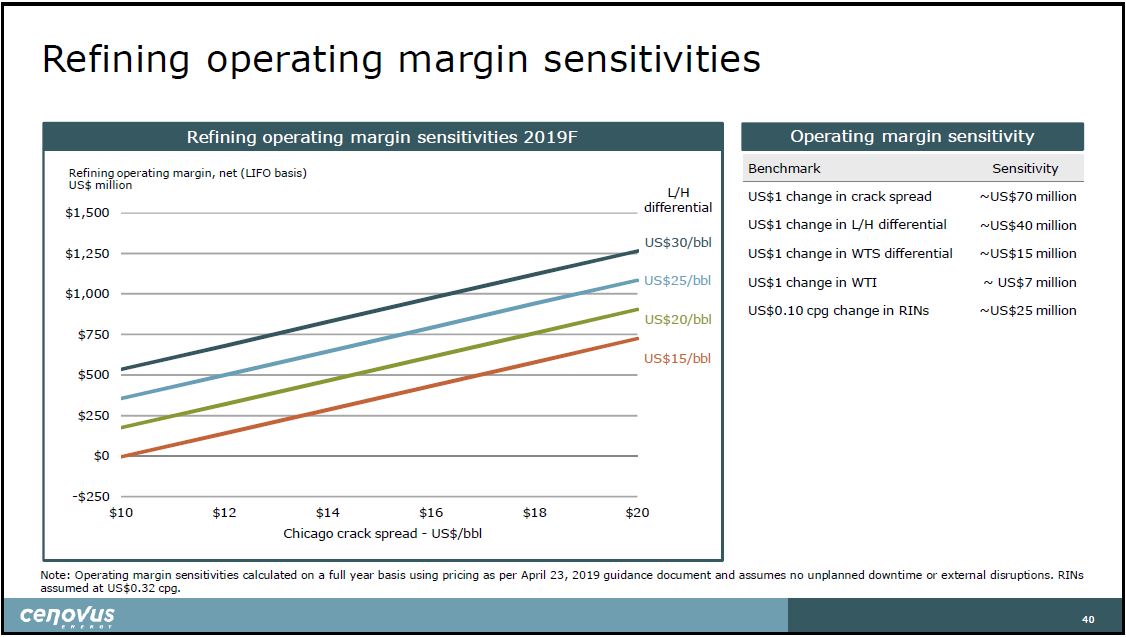
Refining operating margin sensitivities Note: Operating margin sensitivities calculated on a full year basis using pricing as per April 23, 2019 guidance document and assumes no unplanned downtime or external disruptions. RINs assumed…
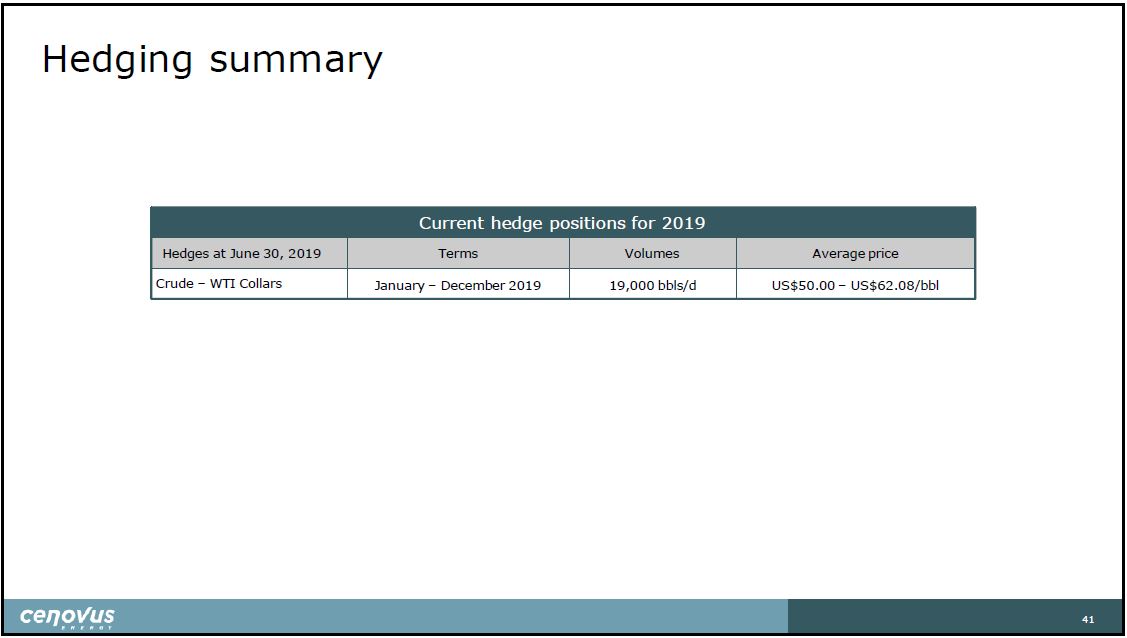
Hedging summary Current hedge positions for 2019 Hedges at June 30, 2019 Terms Volumes Average price Crude – WTI Collars January – December 2019 19,000 bbls/d US$50.00 – US$62.08/bbl
McMurray Telephone Lake Foster Creek Proper Narrows Lake West Kirby Winefred Lake Christina Lake Proper BOREALIS REGION CHRISTINA LAKE REGION FOSTER CREEK REGION Hardy Leismer Alberta Saskatchewan Grosmont Wabiskaw/…
Independent base case sensitivities Increase Decrease Brent (US$/bbl) (As at March 31, 2019 for the remainder of 2019) ($ millions) ($ millions) WTI (US$/bbl) Crude oil (WTI) - US$1.00 change 80 (80) Western Canada Select (US$/bbl)…
 Loading...