QUALIFYING STATEMENTS This supplemental package of earnings support slides provides highlights of major variances for the quarter. This data should be read in conjunction with the information contained in the earnings release for the…
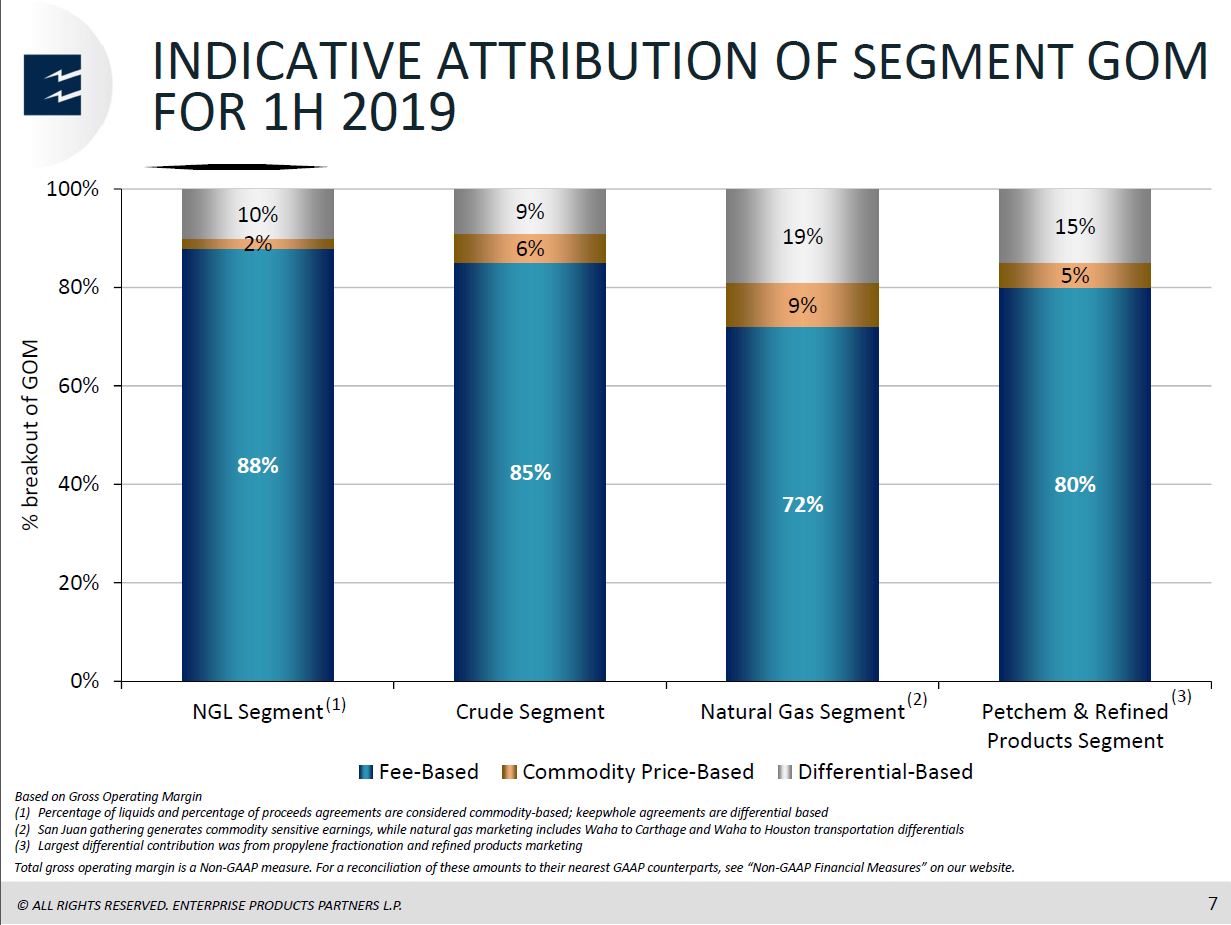
INDICATIVE ATTRIBUTION OF GROSS OPERATING MARGIN Slides 6–8 attribute gross operating margin (GOM) among fee-based, commodity-based and differentialbased business activities. Most activities fit easily into one category; however, the…
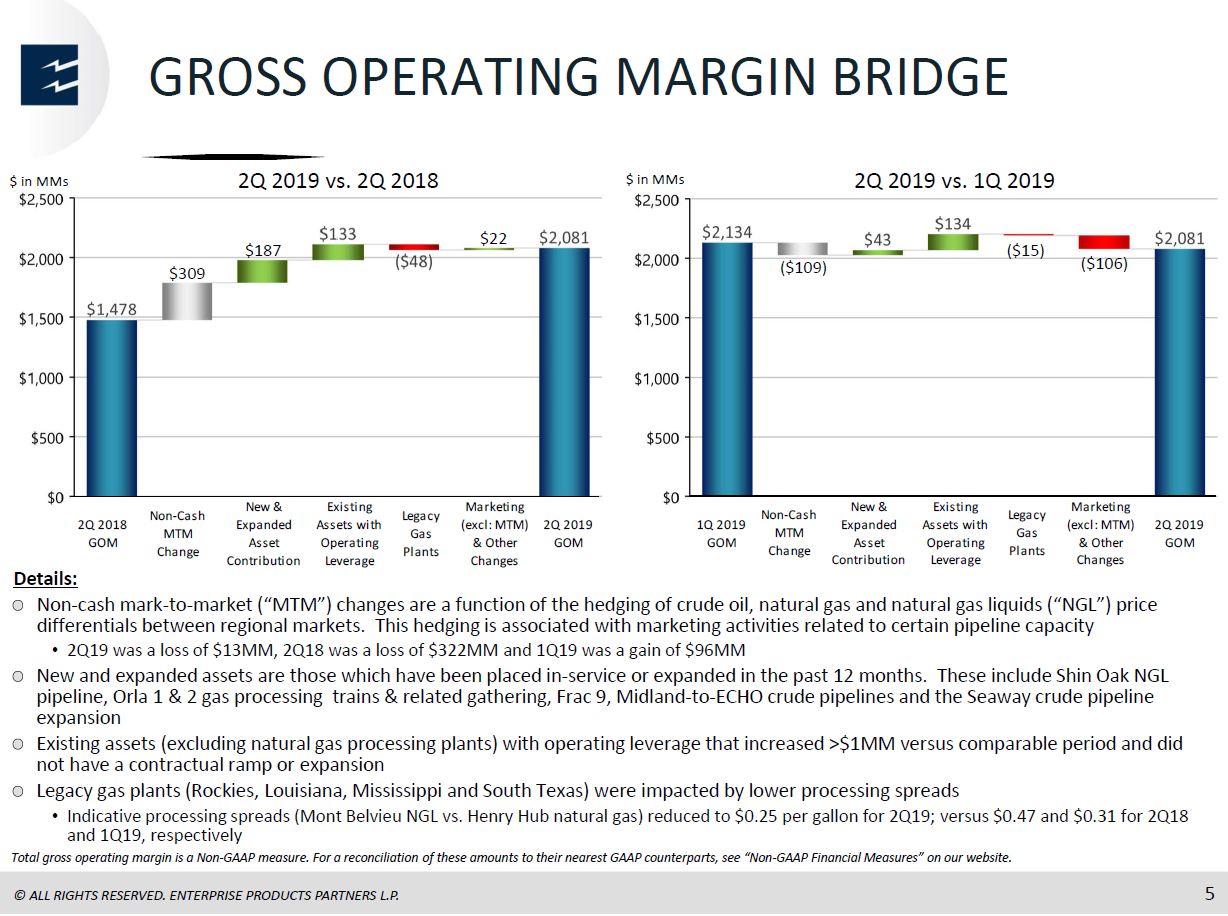
GROSS OPERATING MARGIN BRIDGE Details: Non-cash mark-to-market (“MTM”) changes are a function of the hedging of crude oil, natural gas and natural gas liquids (“NGL”) price differentials between regional markets. This hedging is…
SEGMENT GROSS OPERATING MARGIN VARIANCE 2Q 2019 VS. 2Q 2018
NGL SEGMENT GOM BRIDGE 2Q 2019 VS. 2Q 2018 Details: The Shin Oak NGL pipeline entered limited commercial service in February 2019, and averaged 258 MBPD in 2Q19 Mont Belvieu storage facility increased primarily due to higher storage…
CRUDE OIL SEGMENT GOM BRIDGE 2Q 2019 VS. 2Q 2018 $ in MMs 2Q 2018 GOM Non-Cash MTM Change Permian-to- Houston P/L Hydrocarbon Terminal (EHT) Seaway P/L Other Marketing (excl: MTM & Midland-to- ECHO 1) Eagle Ford Crude JV…
NATURAL GAS SEGMENT GOM BRIDGE 2Q 2019 VS. 2Q 2018 Details: Marketing activities increased primarily due to higher average sales margins across Texas Texas Intrastate System increased primarily due to higher firm capacity fees and…
PETROCHEMICAL AND REFINED PRODUCTS SERVICES GOM BRIDGE 2Q 2019 VS. 2Q 2018 $ in MMs 2Q 2018 GOM Non-Cash MTM Change Refined Products Marketing (excl.MTM) TE Products P/L Mont Belvieu Propylene Plants All Other Changes 2Q…
SEGMENT GROSS OPERATING MARGIN VARIANCE 2Q 2019 VS. 1Q 2019
NGL SEGMENT GOM BRIDGE 2Q 2019 VS. 1Q 2019 Details: Shin Oak benefitted from higher transportation volumes • The system entered limited commercial service in February 2019, and averaged 258 MBPD in 2Q19 Hobbs fractionator was down…
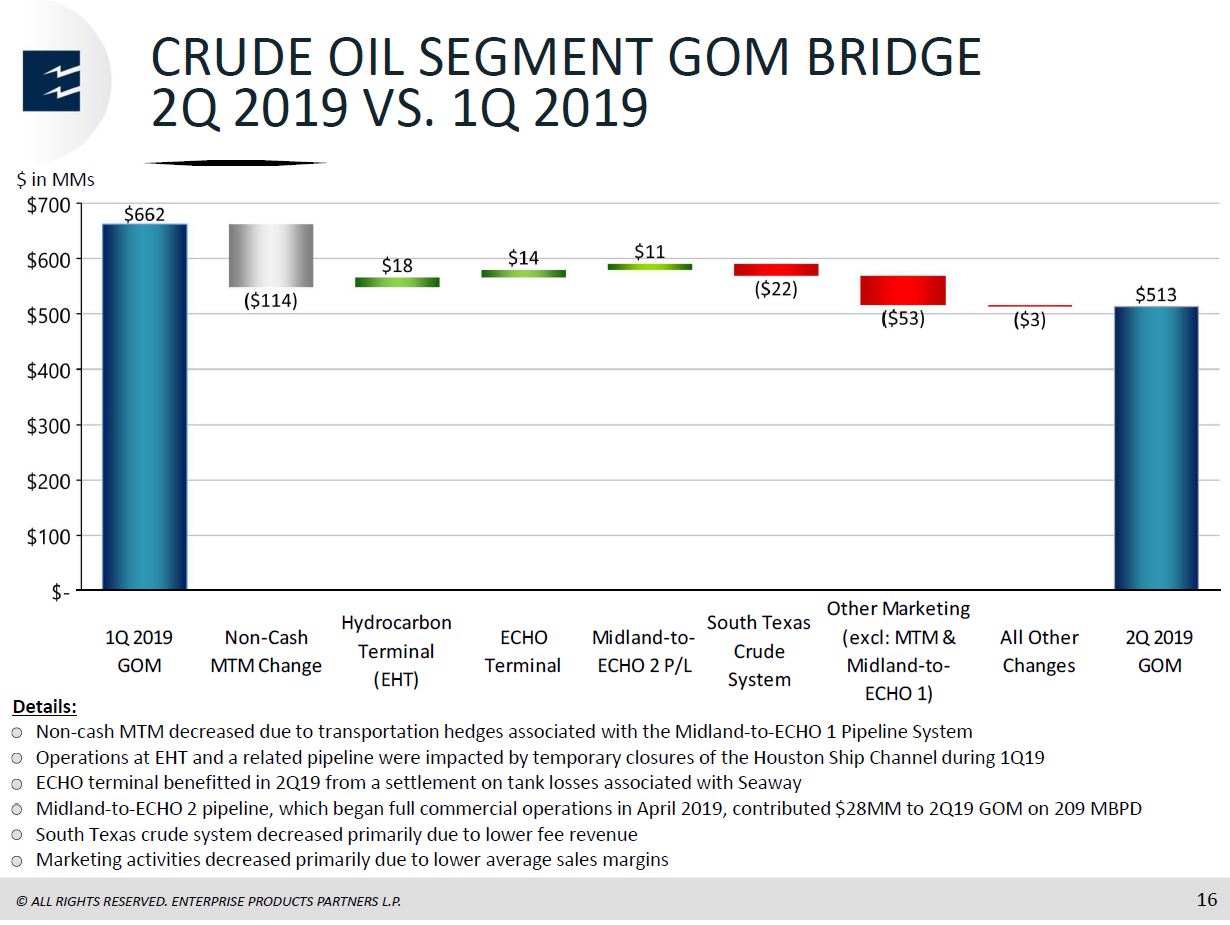
CRUDE OIL SEGMENT GOM BRIDGE 2Q 2019 VS. 1Q 2019 $ in MMs 1Q 2019 GOM Non-Cash MTM Change Hydrocarbon Terminal (EHT) ECHO Terminal Midland-to- ECHO 2 P/L South Texas Crude System Other Marketing (excl: MTM &…
NATURAL GAS SEGMENT GOM BRIDGE 2Q 2019 VS. 1Q 2019 Details: Marketing benefitted from higher average sales margins in 2Q19 Texas Intrastate System increased primarily due to higher average transportation fees on expanded capacity on…
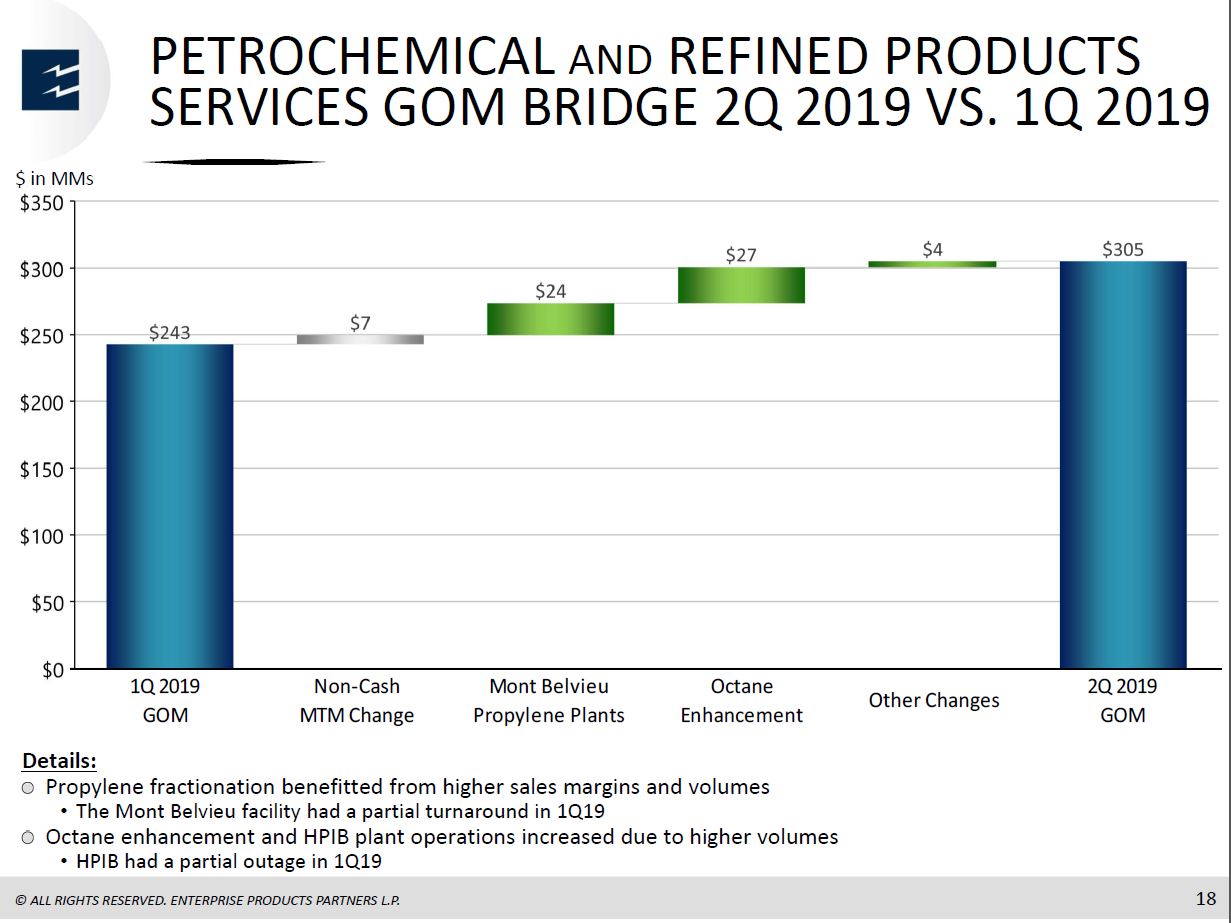
PETROCHEMICAL AND REFINED PRODUCTS SERVICES GOM BRIDGE 2Q 2019 VS. 1Q 2019 Details: Propylene fractionation benefitted from higher sales margins and volumes • The Mont Belvieu facility had a partial turnaround in 1Q19 Octane…
Estimated $1.9 $1.5 $0.9 $0.8 $2.4 $2.8 $0.0 $1.0 $2.0 $3.0 $4.0 $5.0 $6.0 2018 1Q 2019 2Q 2019 3Q 2019 4Q 2019 2020+ $ in Billions WE CONTINUE TO INVEST AND GROW ?$6B of Major Capital Projects Under Construction Shin Oak…
 Loading...