Consolidated revenue totaled 501 million, generating Adjusted EBITDA(1) of 52 million, reported Adjusted EPS(1) of (0.20), and free cash flow(2) of 26 million Stacked under-utilized equipment in several businesses and idled two…
2Q19 Market Conditions Consolidated Revenue Revenue decreased 18% y-o-y and 2% sequentially; Adj. ( in MM) EBITDA decreased 43% y-o-y, but increased 5% sequentially 611 Results negatively affected by increased white space in our…
Revenue by Business Revenue by Basin Fluids Management 7% 9% Rig Services 14% 15% 34% Fracturing Coiled Tubing 44% 5% 13% 10% Cementing 2% 10% 19% Other 18% Completions Wireline & Pumpdown West Texas South Texas /…
( in MM) Segment revenue decreased 22% year-over-year 413 and 1% sequentially to 322MM 373 Segment Adjusted EBITDA decreased 43% year- over-year and 12% sequentially to 48MM 327 322 293 Fracturing revenue decreased 24%…
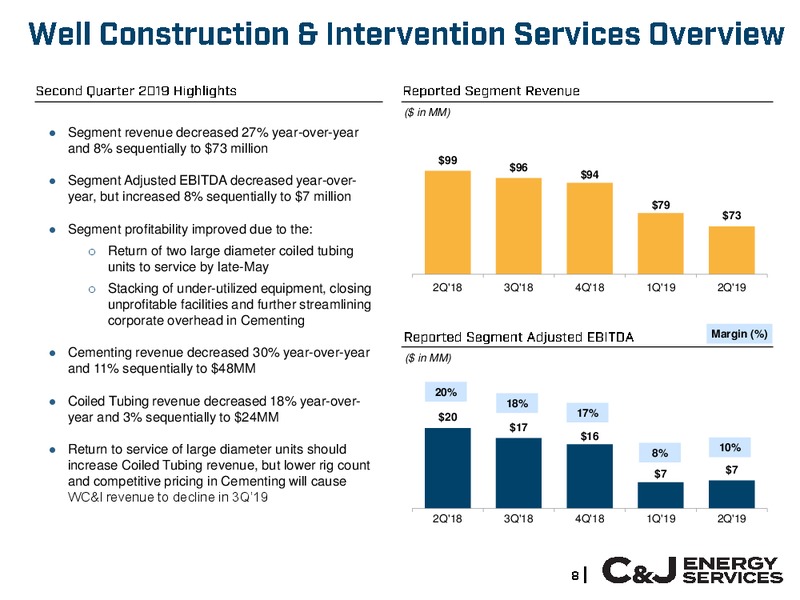
( in MM) Segment revenue decreased 27% year-over-year and 8% sequentially to 73 million 99 96 94 Segment Adjusted EBITDA decreased year-over- year, but increased 8% sequentially to 7 million 79 73 Segment profitability improved…
( in MM) Segment revenue increased 8% year-over-year to 106MM and was essentially flat sequentially 105 106 99 99 104 Segment Adjusted EBITDA increased 17% year-over- year and doubled sequentially to 13MM Segment profitability…
No Leverage and Ample Liquidity Revised 2019 Capital Budget ( in MM) Cash ABL Availability Corporate, Facilities, 393 R&T and Other 371 364 380 7% 8% Growth 235 266 317 275 85% Maintenance 136 114 76 89 9/30/2018…
3Q19 Outlook(1) 2H19 Thoughts(1) Currently expecting consolidated revenue to decline mid to Focused on dedicating deployed fracturing fleets with long- upper single digits sequentially due to the divestiture of our standing, efficient…
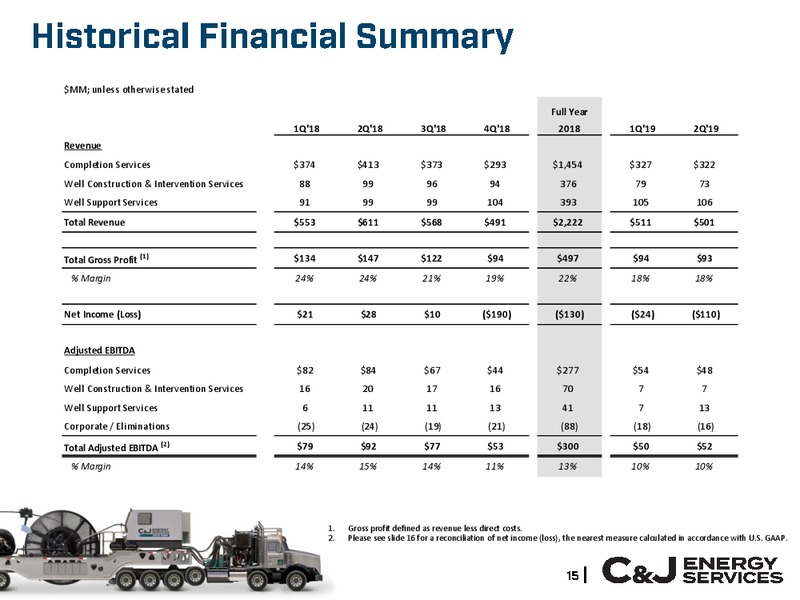
MM; unless otherwise stated Full Year 1Q'18 2Q'18 3Q'18 4Q'18 2018 1Q'19 2Q'19 Revenue Completion Services 374 413 373 293 1,454 327 322 Well Construction & Intervention Services 88 99 96 94 376 79 73 Well Support Services 91 99 99 104…
C&J ENERGY SERVICES INC. AND SUBSIDIARIES RECONCILIATION OF NET INCOME (LOSS) TO ADJUSTED NET INCOME (LOSS) TO ADJUSTED EBITDA (In thousands, except per share data) (Unaudited) Three Months Ended June 30, 2019 March 31, 2019…
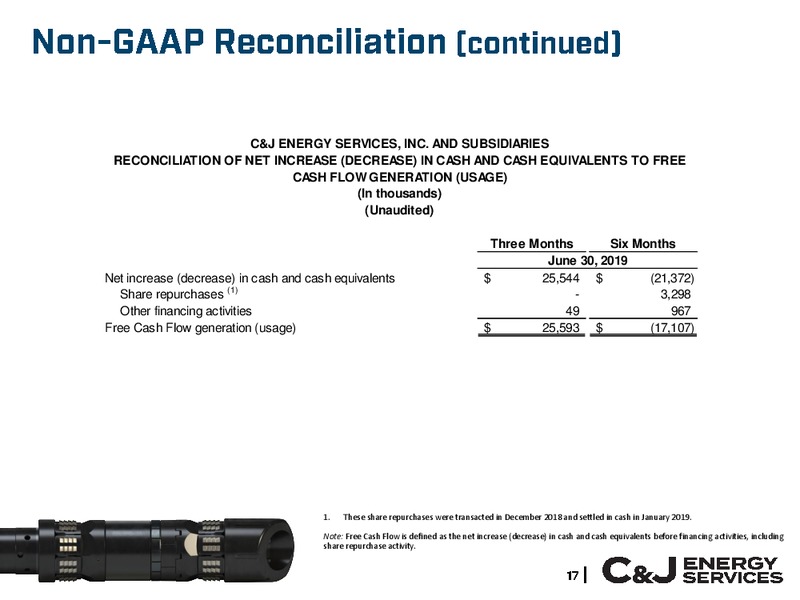
C&J ENERGY SERVICES, INC. AND SUBSIDIARIES RECONCILIATION OF NET INCREASE (DECREASE) IN CASH AND CASH EQUIVALENTS TO FREE CASH FLOW GENERATION (USAGE) (In thousands) (Unaudited) Three Months Six Months June 30, 2019 Net increase…
C&J ENERGY SERVICES, INC. AND SUBSIDIARIES RECONCILIATION OF FRACTURING NET INCOME (LOSS) TO ADJUSTED EBITDA (In thousands, except average active fleet data) (Unaudited) Three Months Ended June 30, 2019 March 31, 2019 December 31,…
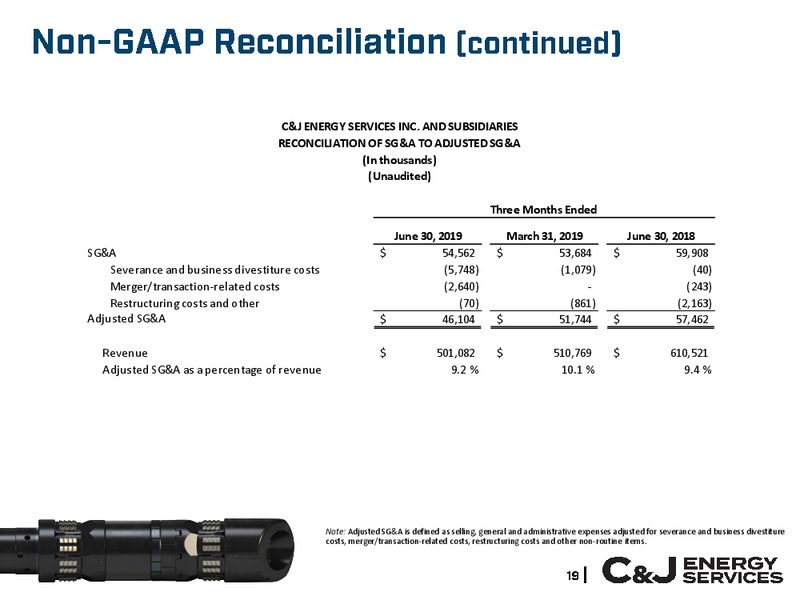
C&J ENERGY SERVICES INC. AND SUBSIDIARIES RECONCILIATION OF SG&A TO ADJUSTED SG&A (In thousands) (Unaudited) Three Months Ended June 30, 2019 March 31, 2019 June 30, 2018 SG&A 54,562 53,684 59,908 Severance and business…
 Loading...