Enable Midstream Partners, LP Third Quarter 2019 Investor Presentation
Contents 1. Enable Midstream Overview 2. Gathering and Processing Segment Overview 4. Transportation and Storage Segment Overview 5. Appendix 4
Enable Midstream Overview
Fully Integrated Midstream Platform Across Leading Basins Significant scale: 7,800 miles of interstate pipelines1, 2,300 miles of intrastate pipelines, 13,900 miles of gathering systems, 15 major processing plants with 2.6 Bcf/d of…
Business Performance Drives Distribution Increase Steadily Growing Distributable Cash Flow History of Strengthening Distribution Coverage in millions 1.45x 810 1.38x 1.30x 760 740 1.18x 1.20x 639 660 1.01x 538 1 1 2015…
Gulf Run Pipeline Gulf Run Project1 The Gulf Run Pipeline, backed by cornerstone shipper Golden Pass LNG, will provide access to some of the most prolific natural gas producing regions in the U.S. As part of the FERC pre-filing…
Gathering and Processing Highlights Rig Activity Remains Strong Rig activity remains strong around Enables gathering footprint with 44 rigs1 currently drilling wells expected 27 to be connected to Enables gathering systems STACK 5…
Transportation and Storage Highlights Unique Market Solutions for Growing Supply and Demand Transported Volumes TBtu/d Contracted or extended over 600,000 Dth/d of transportation capacity during second quarter 2019 6.04 5.28…
Enable: Built for the Long-term 13,900 Miles Strong Business Performance 96% Fee-Based or Hedged Margin4 Gathering Pipelines in millions 4% Large Scale, Fully-Integrated Midstream Platform1 7% 1,180 Adjusted EBITDA 45%…
Responsible Operator, Community Partner Signatory to INGAAs Member of EPAs voluntary Methane Emissions Natural Gas STAR Commitments Environmental program since 2003 Stewardship to minimize methane emissions Focused on…
Appendix Gathering and Processing Segment Overview
Anadarko Basin System Highlights System Map1 Enable serves over 200 producers in the Anadarko Basin and has secured 5.4 million gross acres of dedication under long-term, fee-based contracts Strong rig activity continues in the…
Ark-La-Tex Basin System Highlights System Map2 Enable serves over 100 producers in the Ark-La-Tex Basin and provides gathering and processing services to both rich and lean gas production in the Haynesville, Cotton Valley and lower…
Arkoma Basin System Highlights System Map1 Enable serves over 80 producers in the Arkoma Basin and provides gathering and processing services to both rich and lean gas production in the Woodford Shale play located in Oklahoma and…
Williston Basin 3 System Highlights System Map Record quarterly crude oil gathered volumes1 DUC count is building as a result of third-party natural gas infrastructure constraints that are expected to be alleviated as new…
Appendix Transportation and Storage Segment Overview
Transportation and Storage Segment System Map and Highlights Transportation and Storage Gross Margin1 100% Derived from 88% Derived from EOIT Fee-Based Contracts Firm Contracts MRT 13% 100% EGT Fee-Based 54% EOIT 21% EGT…
Enable Gas Transmission (EGT) Pipeline Highlights Pipeline Map2 5,900-mile1 interstate pipeline serving the 5,900 miles 6.0 Bcf/d capacity Anadarko, Ark-La-Tex and Arkoma 29.0 Bcf storage capacity Basins EGTs primary customers…
Mississippi River Transmission (MRT) Pipeline Highlights Pipeline Map2 1,600-mile1 interstate pipeline that offers shippers competitive rates and is interconnected to diverse supply points MRTs primary customers are utilities and…
Enable Oklahoma Intrastate Transmission (EOIT) Pipeline Highlights Pipeline Map2 Interconnects natural gas supply 2,300 miles 2.08 TBtu/d average throughput from the Anadarko and Arkoma 24.0 Bcf storage capacity Basins to Enables…
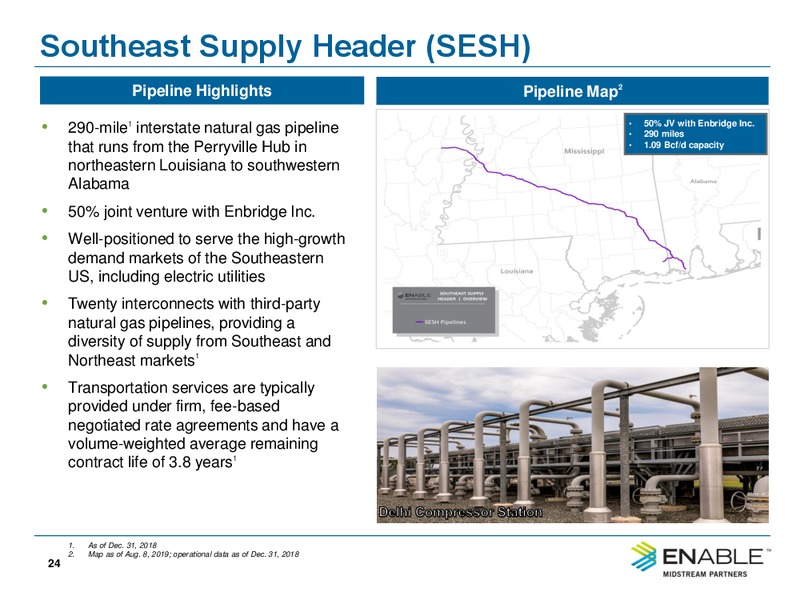
Southeast Supply Header (SESH) Pipeline Highlights Pipeline Map2 290-mile1 interstate natural gas pipeline 50% JV with Enbridge Inc. 290 miles that runs from the Perryville Hub in 1.09 Bcf/d capacity northeastern Louisiana to…
Enable Ownership Structure Note: Structure as of March 31, 2019 27
Large, Diverse and High-Quality Customer Base Enables revenues are strengthened by a diverse, high-quality customer base, including many investment-grade or affiliates of investment-grade companies Many of our customers rely on us for…
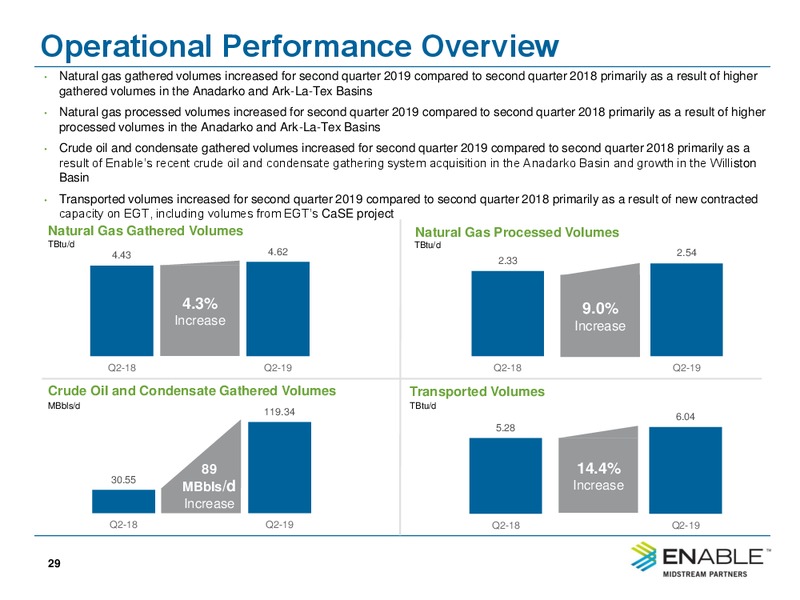
Operational Performance Overview Natural gas gathered volumes increased for second quarter 2019 compared to second quarter 2018 primarily as a result of higher gathered volumes in the Anadarko and Ark-La-Tex Basins Natural gas…
Financial Results Financial Results Quarter over Quarter Q2-19 Q2-18 % Change in millions, except per-unit and ratio data Total Revenues 735 805 9% Gross Margin1 418 361 16% Net Income Attributable to Limited Partners 124 95…
2019 Outlook 2019 outlook provided Nov. 7, 2018, reaffirmed Aug. 6, 2019 2019 Financial Outlook in millions Net Income Attributable to Common Units 435 505 Interest Expense 190 210 Adjusted EBITDA1 1,090 1,180 Series A Preferred…
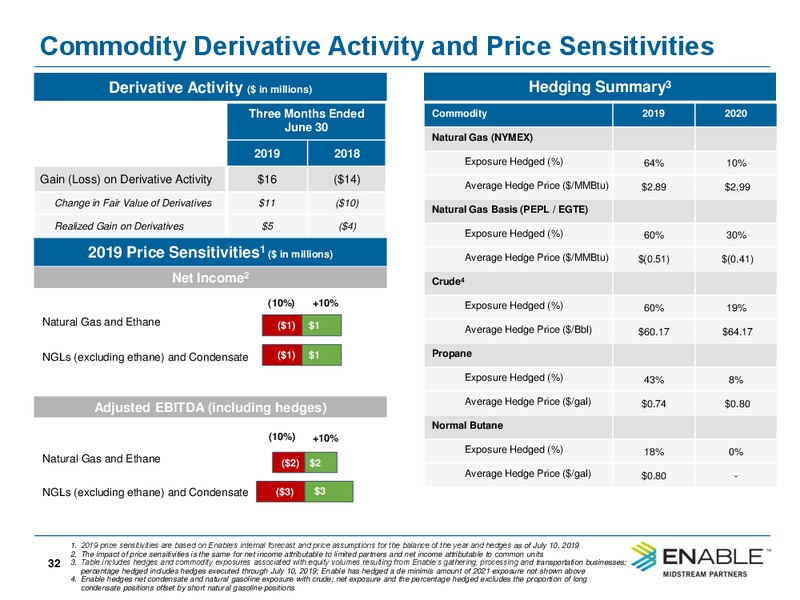
Commodity Derivative Activity and Price Sensitivities Derivative Activity ( in millions) Hedging Summary3 Three Months Ended Commodity 2019 2020 June 30 Natural Gas (NYMEX) 2019 2018 Exposure Hedged (%) 64% 10% Gain (Loss) on…
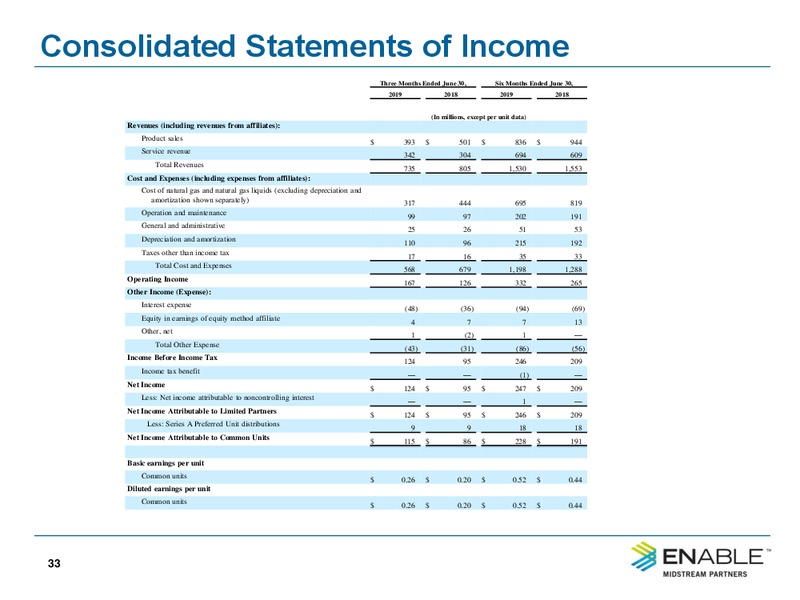
Consolidated Statements of Income Three Months Ended June 30, Six Months Ended June 30, 2019 2018 2019 2018 (In millions, except per unit data) Revenues (including revenues from affiliates): Product sales 393 501 836 944 Service…
2019 Forward Looking Non-GAAP Reconciliation 2019 Outlook (In millions) Reconciliation of Adjusted EBITDA and distributable cash flow to net income attributable to limited partners and calculation of Distribution coverage ratio: Net…
2019 Forward Looking Non-GAAP Reconciliation Continued 2019 Outlook (In millions) Reconciliation of Adjusted interest expense to Interest expense: Interest expense, net of interest income 190 - 210 Amortization of premium on…
 Loading...