USA Compression Partners, LP 2014 RBC Capital Markets MLP Conference November 18-20, 2014
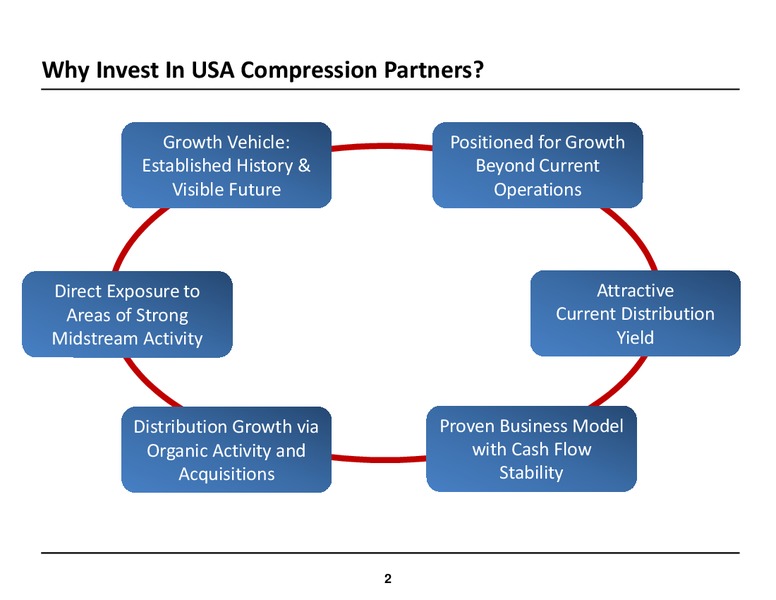
Why Invest In USA Compression Partners Growth Vehicle: Positioned for Growth Established History & Beyond Current Visible Future Operations Direct Exposure to Attractive Areas of Strong Current Distribution Midstream Activity…
The Need For Compression
The Shift to Shale is Expected to Continue Shale Gas Piece of the Growing Pie Continues to Grow Tcfe Overall natural gas production expected to increase 38 Tcfe 40 from 66 Bcf/d in 2012 to 103 Bcf/d through 2040, an increase of 56%…
Market Opportunity: LNG and Natural Gas Exports Approved LNG Projects and Incremental Natural Gas Export Capacity Total 27 Bcf/d; Supports the Need for Midstream Compression LNG Opportunity 23 Bcf/d of LNG Export Projects…
The Need for Compression Critical Infrastructure for Producing & Transporting Hydrocarbons Compression is required to transport natural gas throughout the pipeline system Once installed, becomes part of midstream infrastructure,…
Shale Compression Needs Shale Production Drives Increasing Compression Requirements (1)(2) (HP) Shale gas is typically produced at lower wellhead pressures (0-50 PSIG) in contrast to conventional 350,000 gas wells (100-300 PSIG)…
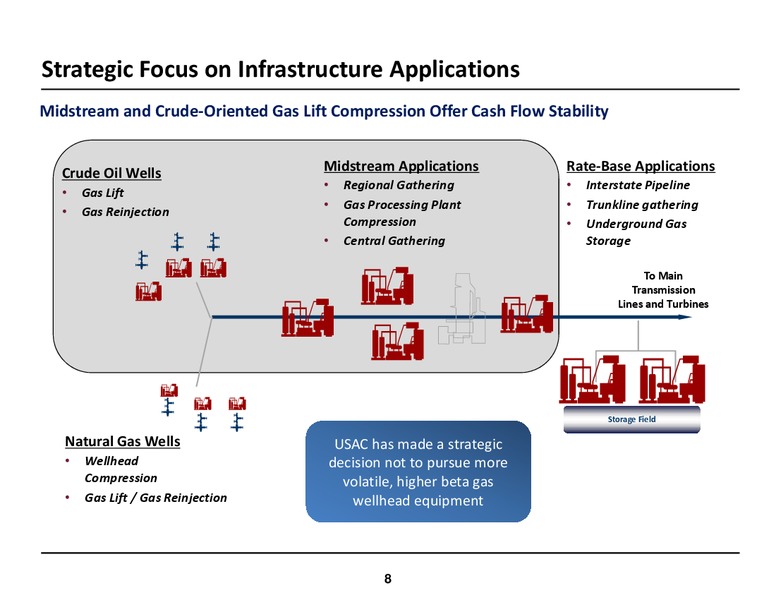
Strategic Focus on Infrastructure Applications Midstream and Crude-Oriented Gas Lift Compression Offer Cash Flow Stability Crude Oil Wells Midstream Applications Rate-Base Applications Regional Gathering Interstate Pipeline Gas Lift…
Business Characteristics Result in Stable Cash Flows Regardless of Commodity Prices Infrastructure-Nature of USAC Assets Provide Cash Flow Stability Long asset life complements gathering systems and processing facilities served…
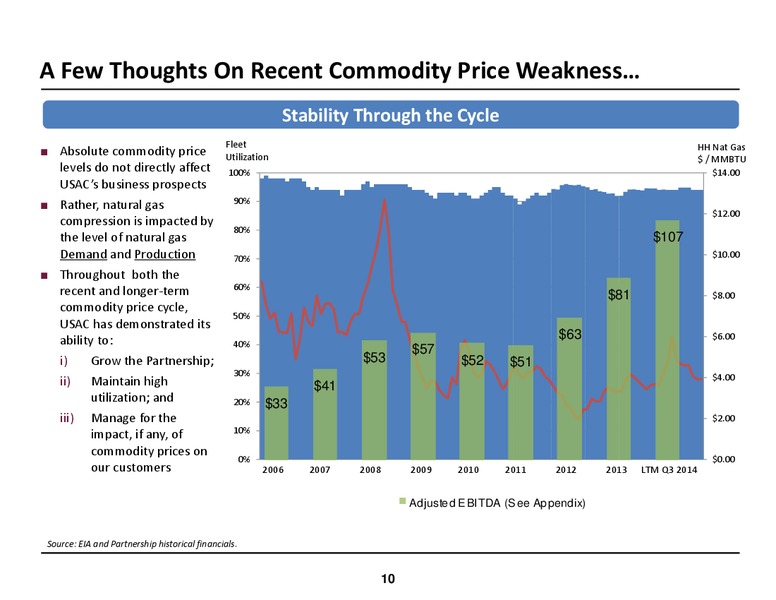
A Few Thoughts On Recent Commodity Price Weakness Stability Through the Cycle Fleet HH Nat Gas Absolute commodity price Utilization / MMBTU levels do not directly affect 100% 14.00 USACs business prospects Rather, natural gas 90%…
USAC: Story of Stability and Growth
USAC History 16-year History of Growth and Differentiated Business Model May 2014: USAC 1998: USAC 1998 2010: USAC Dec 2010: Jan 2013: Aug 2013: USAC completes 169mm founded by CEO grows through organic Riverstone USAC completes…
2014 Capital Program and 2015 HP Orders Continued Build-Out of the High-Growth Shale Plays Drives Robust Capital Program Horsepower 60% higher than initial forecast 400,000 2.5x 2013 total additions 352,000 350,000 52% higher 74,000…
USAC Fleet Overview Natural Crude (Gas-Lift) Combined Gas Assets Assets Fleet Total Units 1,391 1,596 2,987 Fleet Horsepower 1,226K 226K 1,453K Average Age of Fleet 4.9 years 1.6 years 4.1 years Operating Regions Mid-Continent,…
Geographical Presence Presence in Key Geographical Regions Key Customer Profile Oil and Gas Majors Independent E&Ps Large Midstreams & Processors Regional Gathering Systems Marcellus / Utica Shale Anadarko and Hugoton Basins…
Financial Overview and Investment Highlights
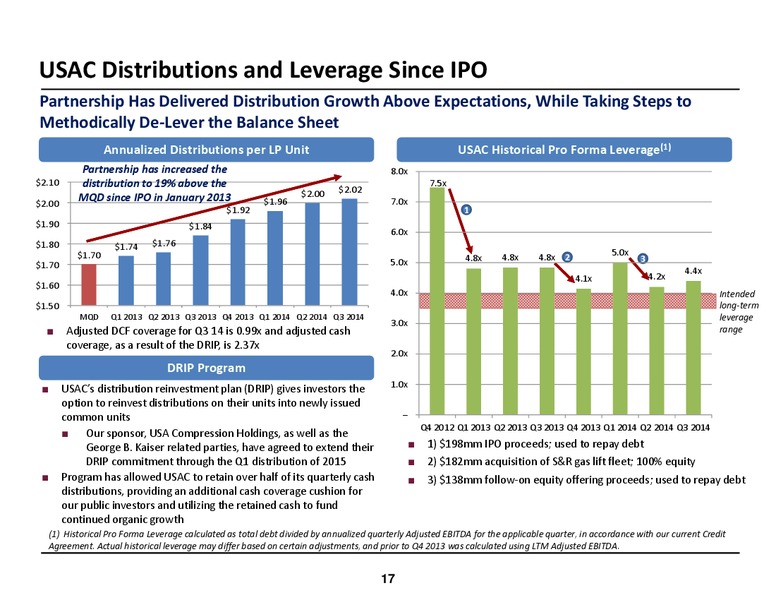
USAC Distributions and Leverage Since IPO Partnership Has Delivered Distribution Growth Above Expectations, While Taking Steps to Methodically De-Lever the Balance Sheet Annualized Distributions per LP Unit USAC Historical Pro Forma…
USAC Investment Highlights USACs Business Prospects Driven By Positive Macro Drivers in the Midstream Industry Continued focus on infrastructure-oriented compression applications; compression is critical to Critical transporting…
Appendix
2014 Guidance USAC expects to trend to the high end of the guidance range for full-year 2014 21
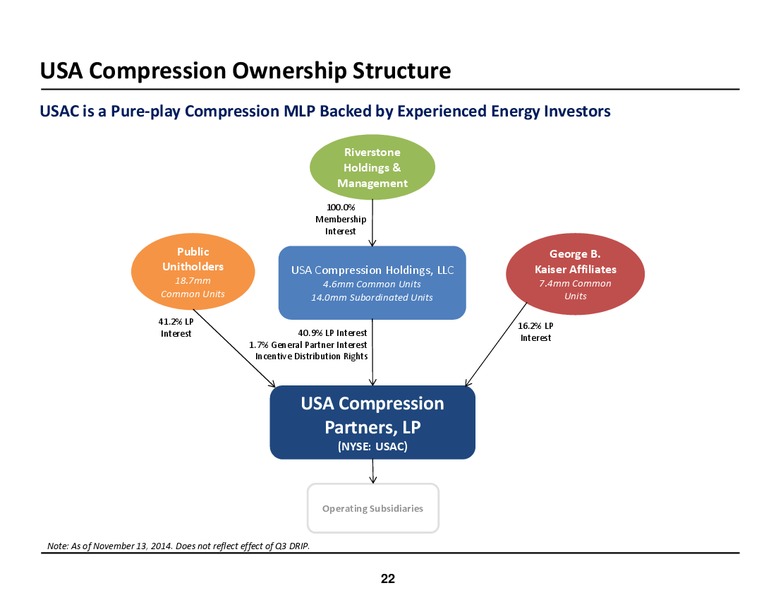
USA Compression Ownership Structure USAC is a Pure-play Compression MLP Backed by Experienced Energy Investors Riverstone Holdings & Management 100.0% Membership Interest Public George B. Unitholders USA Compression Holdings,…
Non-GAAP Reconciliations ( in thousands) Nine Months Ended September 30, Years Ended December 31, 2014 2013 2013 2012 2011 Net income 16,446 6,634 11,071 4,503 69 Interest expense 9,269 8,963 12,488 15,905 12,970 Depreciation and…
Non-GAAP Reconciliations (contd) Three Months Ended ( in thousands) September 30, 2014 Net income 5,013 Plus: Non-cash interest expense 43 Plus: Depreciation and amortization 18,261 Plus: Unit-based compensation (1) 855 Plus:…
 Loading...