SUMMER 2019 INVESTOR PRESENTATION CONFIDENTIAL NOT FOR DISTRIBUTION
Table of Contents Section I Company Overview and History Section II Detailed Asset Overview Section III Mineral Market Opportunity 3
Section I Company Overview and History 4
Kimbell Overview Q119 Combined Production from the Most Company Overview Economic Areas (Boe/d)(9) Royalty interests in over 92,000 wells across 13 million gross acres (approximately Permian 144,100 net royalty acres) in the lower…
Company Highlights Net Royalty Acre position of approximately 144,100 acres(1) across multiple producing basins provides diversified scale Key basins include the Permian and Mid-Con where 44% of the Net Royalty Acres are located…
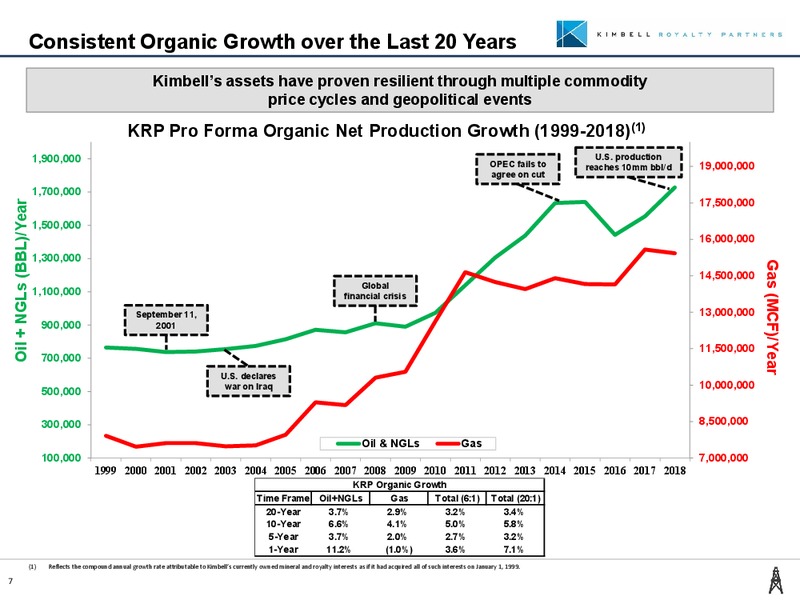
Consistent Organic Growth over the Last 20 Years Kimbells assets have proven resilient through multiple commodity price cycles and geopolitical events KRP Pro Forma Organic Net Production Growth (1999-2018)(1) 1,900,000 OPEC fails…
Expected Favorable Tax Treatment of Earnings(1) On May 12, 2019, Kimbell announced the expected favorable federal income tax treatment of its future earnings and distributions paid to common unitholders for at least the next seven…
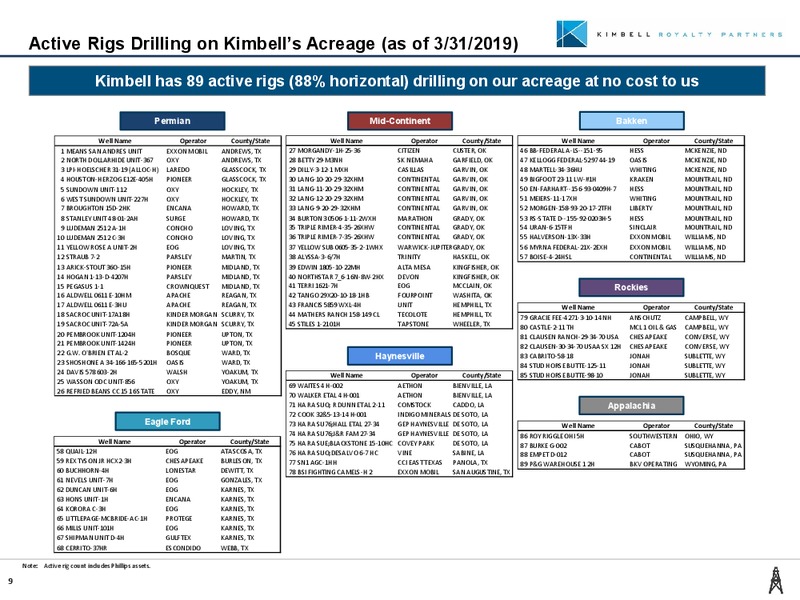
Active Rigs Drilling on Kimbells Acreage (as of 3/31/2019) Kimbell has 89 active rigs (88% horizontal) drilling on our acreage at no cost to us Permian Mid-Continent Bakken Well Name Operator County/State Well Name Operator…
Kimbells Track Record Since IPO Production Growth (Boe/d)(1) Net Royalty Acres(2) 11,958 144,117 10,066 131,909 115,256 115,256 8,546 69,807 69,807 71,336 71,276 62,992 3,297 3,508 3,650 3,633 3,116 3,067 1Q'17 2Q'17 3Q'17…
Growth in Market Capitalization and Enterprise Value From our IPO in February 2017 through today, the market capitalization and enterprise value for KRP have increased 169% and 227%, respectively Market Capitalization (mm)…
Section II Detailed Asset Overview 12
Scale Across Lower 48 13.0 million gross acres across 28 states and in every major producing basin(1) 95% of all rigs in the Lower 48 are in counties where Kimbell holds mineral interests positions(2) (1) Includes the Phillips…
Kimbells Permian Position 2.6 million gross and 23,500 net royalty acres represent approximately 20% and 16%, respectively, of Kimbells acreage portfolio 26 rigs operating on KRPs Permian acreage Q119 production of 1,570 Boe/d…
Kimbells Mid-Continent Position 3.6 million gross and 40,600 net royalty acres represent approximately 28% and 28%, respectively, of Kimbells acreage portfolio 19 rigs operating on KRPs Mid-Con acreage Q119 production of 1,523…
Kimbells Haynesville Position 745,700 gross and 7,100 net royalty acres represent approximately 6% and 5%, respectively, of Kimbells acreage portfolio 10 rigs operating on KRPs Haynesville acreage Q119 production of 1,639 Boe/d…
Kimbells Appalachia Position 721,700 gross and 23,100 net royalty acres represent approximately 6% and 16%, respectively, of Kimbells acreage portfolio 4 rigs operating on KRPs Appalachia acreage Q119 production of 1,676 Boe/d…
Kimbells Eagle Ford Position 532,100 gross and 6,300 net royalty acres represent approximately 4% and 4%, respectively, of Kimbells acreage portfolio 11 rigs operating on KRPs Eagle Ford acreage Q119 production of 1,624 Boe/d…
Kimbells Bakken Position 1.6 million gross and 6,000 net royalty acres represent approximately 12% and 4%, respectively, of Kimbells acreage portfolio 12 rigs operating on KRPs Bakken acreage Q119 production of 516 Boe/d…
Kimbell has the Optimal Balance of Unconventional and Conventional Assets Kimbell has approximately 31% of its overall production from conventional assets including certain Enhanced Oil Recovery (EOR) projects. This conventional…
5-Year PDP Decline Forecast Shallow decline rates from both its conventional and unconventional assets help to create Kimbells best-in- class overall proved developed producing (PDP) decline rate of 12%. This is in contrast to many of…
Section III Mineral Market Opportunity 22
Tremendous Consolidation Opportunity National minerals market is approximately 2x larger than the entire Permian working interest market with only 1/32nd of the public consolidation National Minerals Market Permian Basin Working…
Highest Cash Flow Yield Across Multiple Sectors U.S. oil and gas royalty companies offer an attractive 8.3% yield versus the rest of the public space including midstream companies, integrateds and large cap E&Ps. In addition, royalty…
Minerals have Outperformed Other Broad Sectors In recent years, the minerals market has significantly outperformed other major sectors in regards to total return Total Return by Sector (1/1/18 Present) 35.0% 25.0% 23.1%…
Kimbells Performance vs. Index Total Return YTD 2019(1) 27% (3%) KRP XOP 1/1/19 2/23/19 4/16/19 6/6/19 Total Return 2018(2) (6%) KRP XOP (28%) 1/1/18 5/3/18 9/1/18 12/31/18 Source: Company filings and S&P…
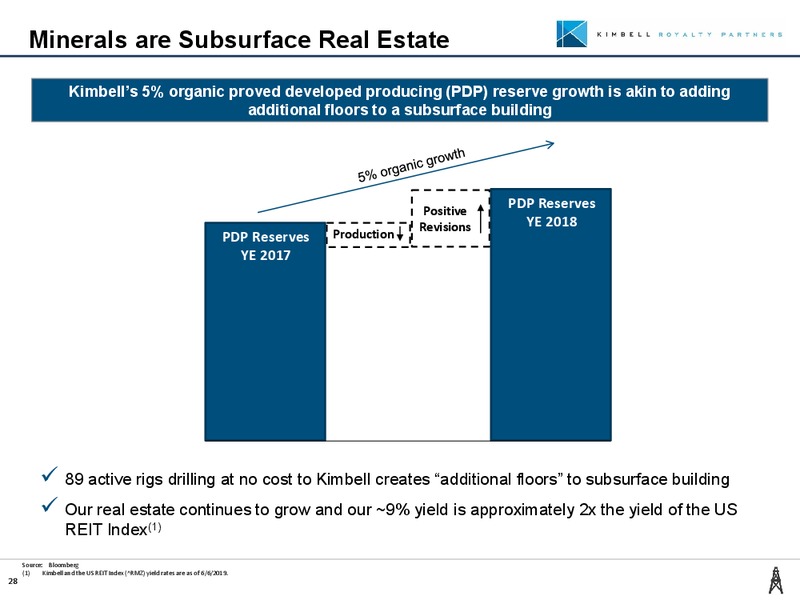
Minerals are Subsurface Real Estate Kimbells 5% organic proved developed producing (PDP) reserve growth is akin to adding additional floors to a subsurface building Positive PDP Reserves Revisions YE 2018 PDP Reserves…
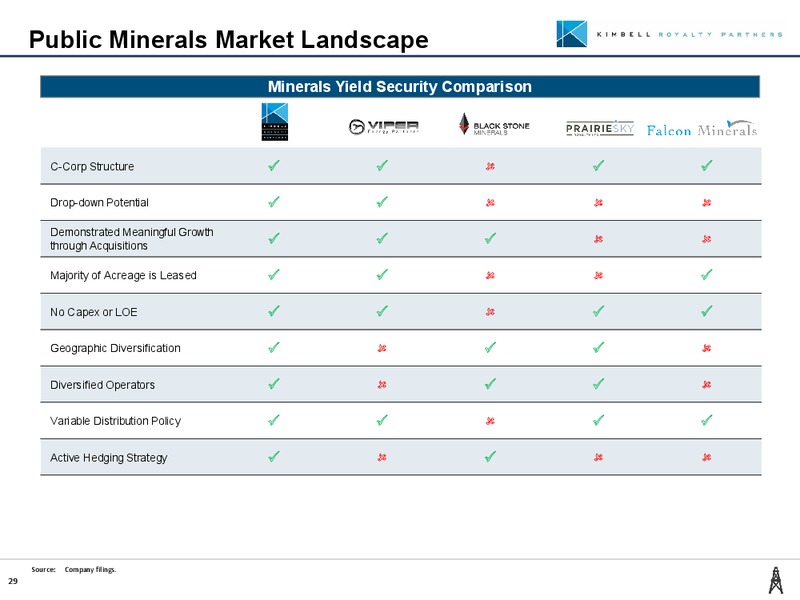
Public Minerals Market Landscape Minerals Yield Security Comparison C-Corp Structure Drop-down Potential Demonstrated Meaningful Growth through Acquisitions Majority of Acreage is Leased No Capex or LOE Geographic…
Appendix 30
History Kimbell has a strong track record of success as a natural consolidator in the mineral and royalty industry Completed Closed Phillips March 2019 February 2017 September 2018 conversion acquisition for With a to…
Production and Net Royalty Acreage Overview Q119 Combined Production from the Most Net Royalty Acres(2) Economic Areas (Boe/d)(1) Permian Other Other 13% 26% Mid-Continent 23% 28% Mid-Continent 13%…
KRP Unitholders Total KRP Units 46,909,745(1) Common Units Class B Units 23,095,403 23,814,342 Top Common Unitholders Top Class B Unitholders 1. Wellington Management 1. EnCap Investments LP 2. FMR LLC 2. KKR 3.…
Defining a Net Royalty Acre The calculation of a Net Royalty Acre differs across industry participants Kimbell calculates its Net Royalty Acres(1) as follows: Net Mineral Acres x Royalty Interest(2) This methodology provides a…
Mineral Interests Generally Senior to All Claims in Capital Structure In many states, mineral and royalty interests are considered by law to be real property interests and are thus afforded additional protections under bankruptcy…
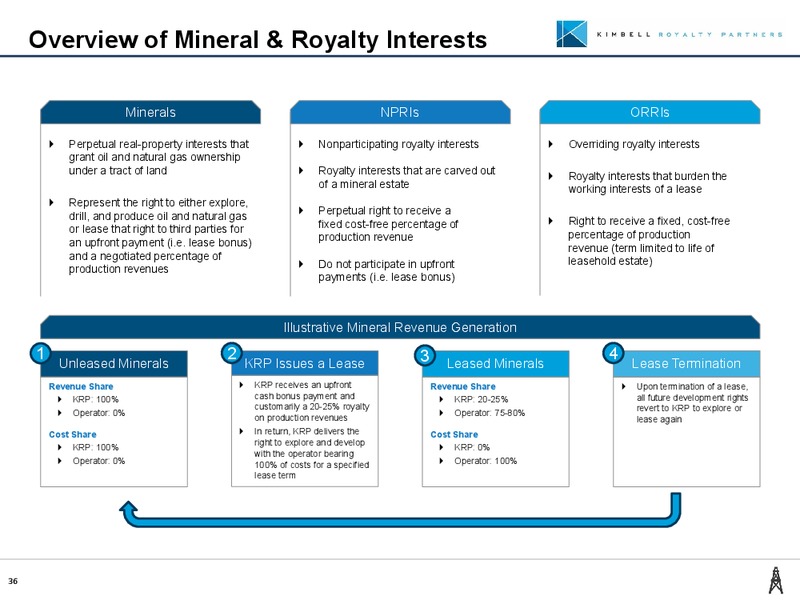
Overview of Mineral & Royalty Interests Minerals NPRIs ORRIs Perpetual real-property interests that Nonparticipating royalty interests Overriding royalty interests grant oil and natural gas ownership under a tract of land Royalty…
Historical Selected Financial Data Non-GAAP Reconciliation (in thousands) Three Months Ended March 31, 2019 Reconciliation of net cash provided by operating activities to Adjusted EBITDA Net cash provided by operating activities…
 Loading...