3Q19 Earnings Presentation October 30, 2019 Presented by: Anthony G. Petrello Chairman, President, & Chief Executive Officer William J. Restrepo Chief Financial Officer
Recent Company Highlights Increased U.S. Drilling average daily margins to 12,400 from 12,061 in 2Q Modest increase in Lower 48 daily margins to 10,231 from 10,222 in 2Q as industry rig count declines by 11% International…
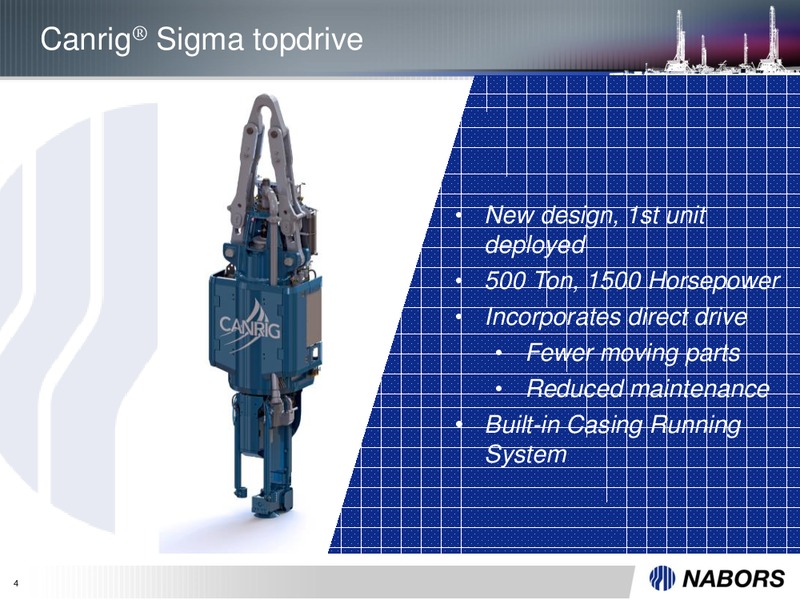
Canrig Sigma topdrive New design, 1st unit deployed 500 Ton, 1500 Horsepower Incorporates direct drive Fewer moving parts Reduced maintenance Built-in Casing Running System 4
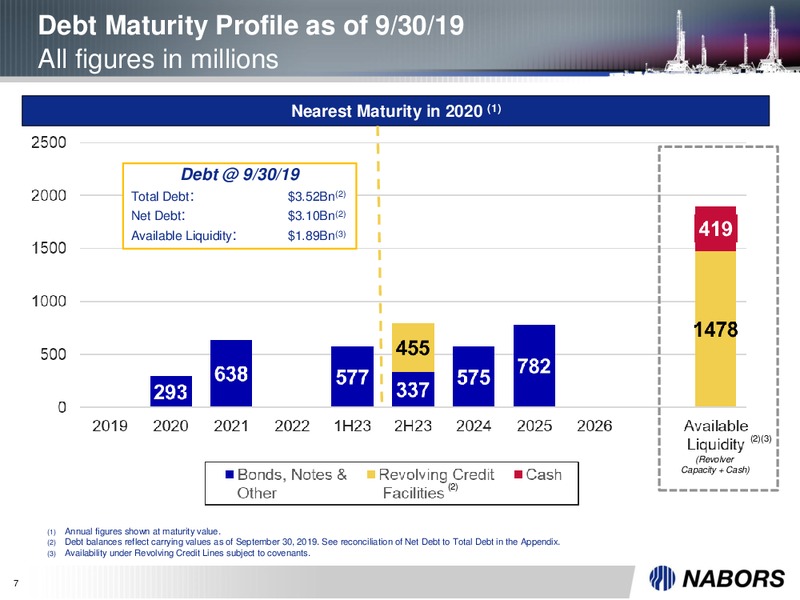
Debt Maturity Profile as of 9/30/19 All figures in millions Nearest Maturity in 2020 (1) Debt 9/30/19 Total Debt: 3.52Bn(2) Net Debt: 3.10Bn(2) Available Liquidity: 1.89Bn(3) (2)(3) (Revolver Capacity + Cash) (2) (1)…
Business Segments 8
3Q19 Rig Utilization & Availability (1) 3Q19 Average Average Rig Fleet Rigs Working Utilization U.S. Lower 48 AC 1500HP 119 98 87% AC Others 63 8 13% SCR Rigs 8 2 22% U.S. Lower 48 Total 190 108 67% U.S. Offshore 12 3 25%…
Lower 48 Rig Utilization by Type As of September 30, 2019 Rig Type Total Rigs Active Total Util. AC % PACE-X 38 47 81% PACE-M750 7 7 100% PACE-M800 6 6 100% PACE-M1000 3 4 75% PACE-B 25 29 86% PACE -S 9 11 82% UPGRADED…
Nabors Drilling Operations As of September 30, 2019 Total = 205 U.S. 108 Kazakhstan 6 Venezuela 3 Mexico 2 Saudi Arabia 42 Oman 4 Algeria 2 Colombia 12 Canada 9 India 2 Argentina 10 Russia 3 Kuwait 2 11 Please refer to the…
Appendix 12
Rig Margins & Activity 3Q18 4Q18 1Q19 2Q19 3Q19 Avg. Rigs Avg. Rigs Avg. Rigs Avg. Rigs Avg. Rigs Margin(1) Working Margin(1) Working Margin(1) Working Margin(1) Working Margin(1) Working U.S. Drilling 10,540 111.6 11,428 117.3…
Reconciliation of Adjusted EBITDA to Income (Loss) from Cont. Operations Before Income Taxes Adjusted operating income (loss) represents income (loss) from continuing operations before income taxes, interest expense, earnings (losses)…
Reconciliation of Free Cash Flow After Dividends to Net Cash Provided by Operating Activities Free cash flow after dividends represents net cash provided by operating activities less cash used for investing activities and cash paid…
 Loading...