Third quarter 2019 conference call November 1, 2019
Russ Girling President & CEO 3
Third quarter 2019 accomplishments Generated strong financial results Comparable earnings were 1.04 per common share Comparable funds generated from operations of 1.8 billion Advanced 30 billion secured capital program Placed 8.2…
Financial highlights Three months ended September 30 (NonGAAP) Comparable Comparable Comparable funds earnings per common share* EBITDA* generated from operations* (Dollars) (Millions) (Millions) 4% increase 14% increase 15%…
Financial highlights Nine months ended September 30 (NonGAAP) Comparable Comparable Comparable funds earnings per common share* EBITDA* generated from operations* (Dollars) (Millions) (Millions) 10% increase 15% increase 14%…
Natural Gas Pipelines recent developments Canadian Natural Gas Pipelines Announced 1.2 billion West Path Delivery Program Now advancing 10 billion NGTL System expansion program that will add 3.5 Bcf/d of delivery capacity…
Liquids Pipelines recent developments Assets continue to produce strong operating results Completed the sale of 85 per cent equity interest in Northern Courier Keystone XL continues to advance Received new Presidential Permit in March…
Power and Storage recent developments Ontario natural gasfired power plants 2.87 billion asset sale expected to close by the end of first quarter 2020 Bruce Power Unit 6 Major Component Replacement expected to begin in early 2020…
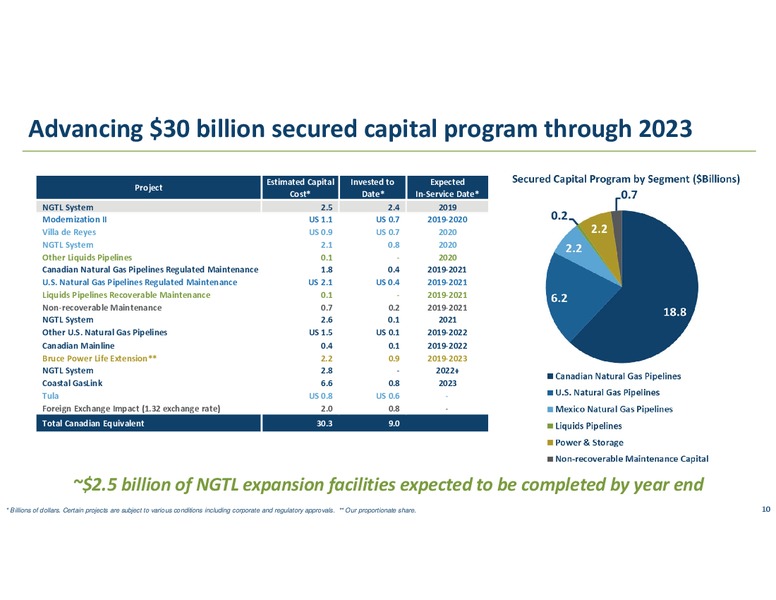
Advancing 30 billion secured capital program through 2023 Estimated Capital Invested to Expected Project Cost* Date* InService Date* NGTL System 2.5 2.4 2019 Modernization II US 1.1 US 0.7 20192020 Villa de Reyes US 0.9 US 0.7…
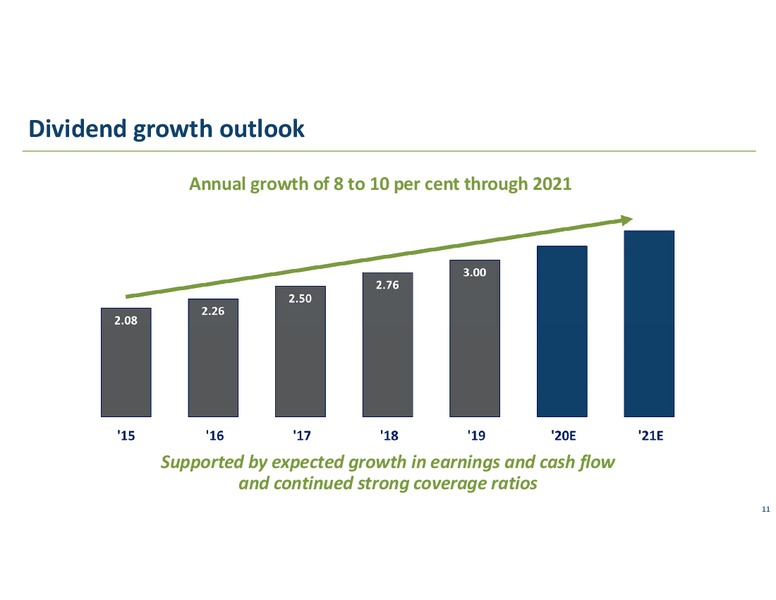
Dividend growth outlook Annual growth of 8 to 10 per cent through 2021 Supported by expected growth in earnings and cash flow and continued strong coverage ratios 11
Key takeaways Proven strategy Low risk business model 95% of comparable EBITDA from regulated assets or longterm contracts Business continued to produce strong results in third quarter 2019 Demand for our services has never been…
Don Marchand Executive VP & CFO 13
Consolidated results of operations (millions of dollars, except per share amounts) Three months ended September 30 Nine months ended September 30 2019 2018 2019 2018 Net Income Attributable to Common Shares 739 928 2,868 2,447…
Business segment results(1) (millions of dollars) Three months Nine months ended September 30 ended September 30 2019 2018 2019 2018 Comparable EBITDA(2) Canadian Natural Gas Pipelines 572 522 1,656 1,561 U.S. Natural Gas…
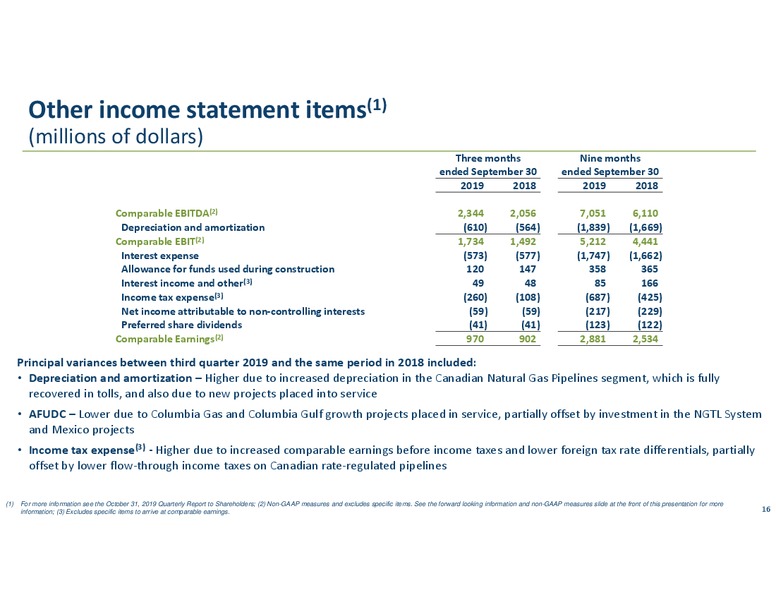
Other income statement items(1) (millions of dollars) Three months Nine months ended September 30 ended September 30 2019 2018 2019 2018 Comparable EBITDA(2) 2,344 2,056 7,051 6,110 Depreciation and amortization (610) (564)…
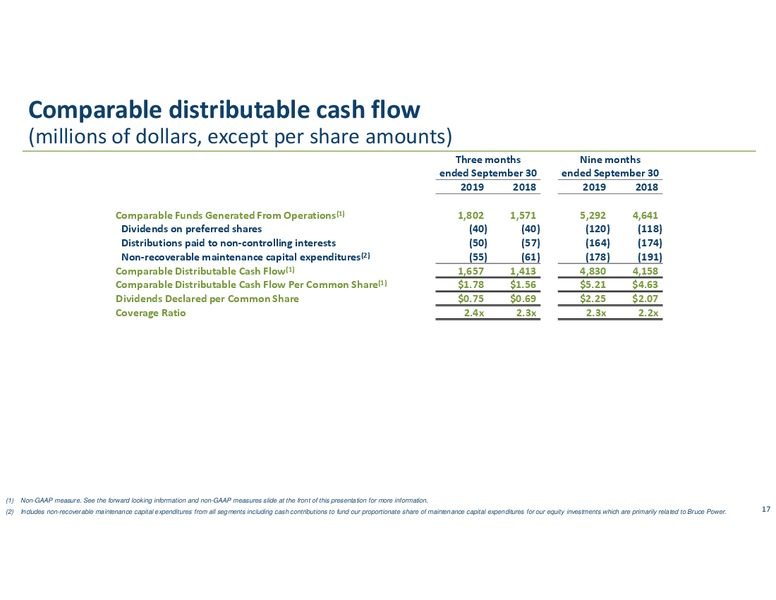
Comparable distributable cash flow (millions of dollars, except per share amounts) Three months Nine months ended September 30 ended September 30 2019 2018 2019 2018 Comparable Funds Generated From Operations(1) 1,802 1,571 5,292…
Funding program continued to advance in third quarter Strong, predictable and growing cash flow from operations Comparable funds generated from operations of 1.8 billion in the quarter Accessed capital markets on compelling terms Issued…
2019 Funding program complete Billions 7.8 billion raised in 2019 through an array of attractive funding options 3.4 billion from monetization of Coolidge, Northern Courier and certain Columbia Midstream assets Additional 2.9…
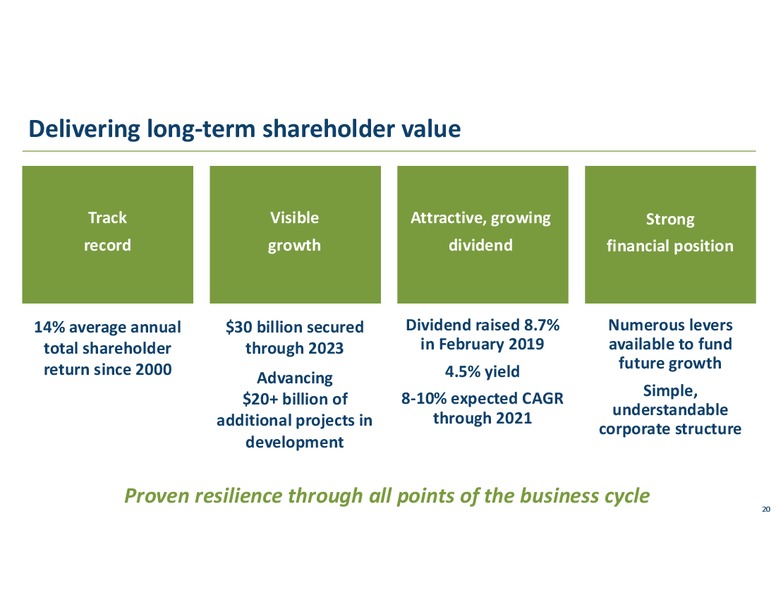
Delivering longterm shareholder value Track Visible Attractive, growing Strong record growth dividend financial position 14% average annual 30 billion secured Dividend raised 8.7% Numerous levers total shareholder through 2023…
Question & answer period 21
Third quarter 2019 conference call November 1, 2019
Appendix Reconciliation of nonGAAP measures (millions of dollars) Three months Nine months ended September 30 ended September 30 2019 2018 2019 2018 Comparable EBITDA(1) 2,344 2,056 7,051 6,110 Depreciation and amortization (610)…
Appendix Reconciliation of nonGAAP measures continued (millions of dollars) Three months Nine months ended September 30 ended September 30 2019 2018 2019 2018 Net Cash Provided by Operations 1,585 1,299 5,256 4,516…
 Loading...