L A R E D O P E T R O L E U M Third-Quarter 2019 Earnings Presentation
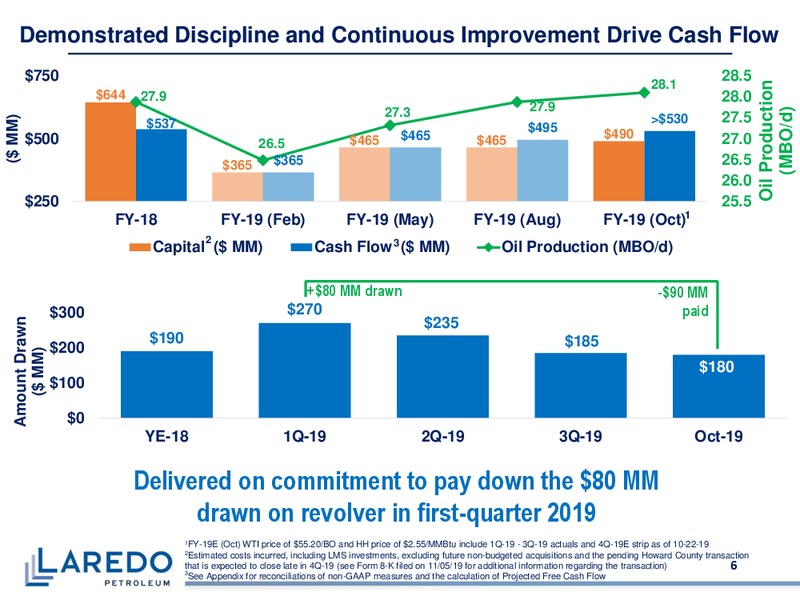
Pivoting Strategy to Increase Stakeholder Value Target consistent Free Cash Flow1 generation and oil growth per net debt-adjusted share Continuous In Process Opportunistic Improve corporate Increase scale Optimize existing returns…
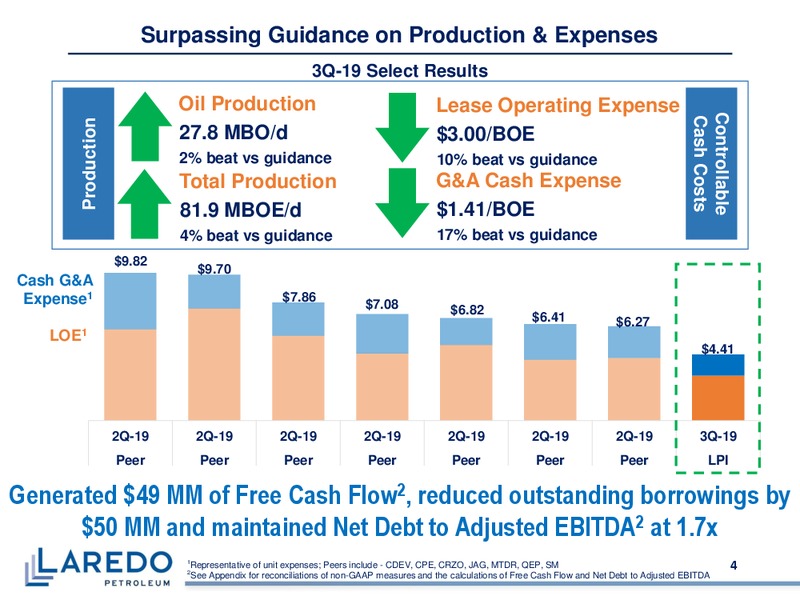
Surpassing Guidance on Production & Expenses 3Q-19 Select Results Oil Production Lease Operating Expense Controllable Cash Costs Production 27.8 MBO/d 3.00/BOE 2% beat vs guidance 10% beat vs guidance Total Production G&A…
Optimizing Well Productivity and Costs on Existing Acreage 2019 Wider-Spaced Well Results 100 Wider-spaced packages are outperforming Production (MBO) LPIs oil type curve by 18%, reiterating the Cumulative Oil 80 Companys…
Accretive Tier-One Acquisition Delivers Higher-Margin Production 130 MM acquisition price1, well below historic Howard County averages High-margin, tier-one acreage 7,360 net acres / 750 net royalty acres Howard County Relevant…
Howard County Development to Drive Capital Efficiency Cumulative Cash Flow per Well Increased FY-20 & FY-21 5 Expectations: Cumulative Undiscounted 3 Mid-to-high single digit Cash Flow ( MM) 1 annual oil growth -1 40% oil…
4Q-19 Guidance Production Total production (MBOE/d) 76.5 Oil production (MBbl/d) 26.0 Average sales price realizations: (excluding derivatives) Oil (% of WTI) 99% NGL (% of WTI) 20% Natural gas (% of Henry Hub) 29% Operating…
L A R E D O P E T R O L E U M APPENDIX
Oil, Natural Gas & Natural Gas Liquids Hedges Hedge Product Summary 4Q-19 FY-20 FY-21 Oil total floor volume (Bbl) 2,300,000 7,539,600 912,500 Oil wtd-avg floor price (/Bbl) 60.42 58.79 45.00 Oil total floor volume w. deferred…
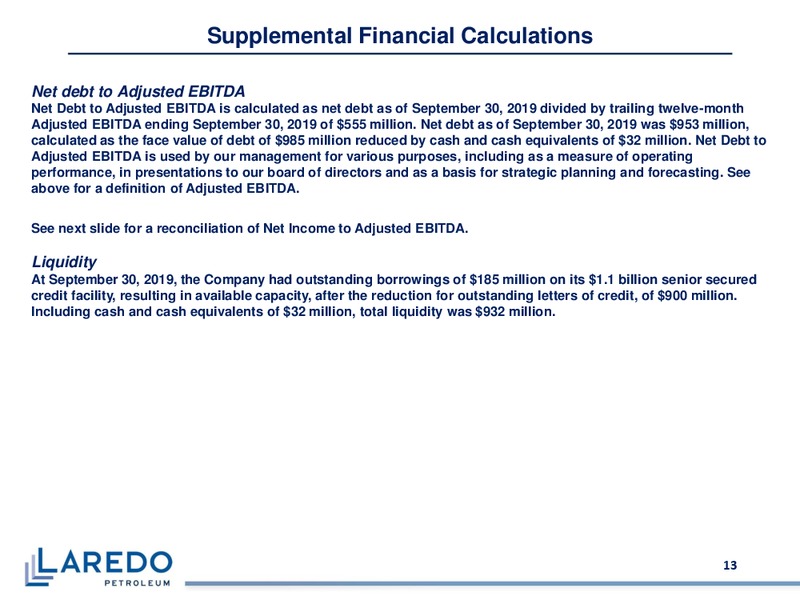
Supplemental Financial Calculations Net debt to Adjusted EBITDA Net Debt to Adjusted EBITDA is calculated as net debt as of September 30, 2019 divided by trailing twelve-month Adjusted EBITDA ending September 30, 2019 of 555 million.…
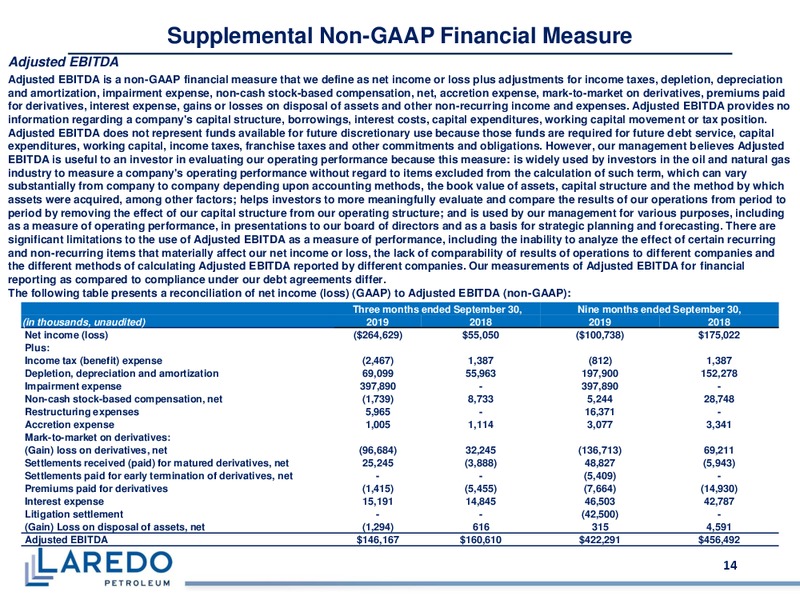
Supplemental Non-GAAP Financial Measure Adjusted EBITDA Adjusted EBITDA is a non-GAAP financial measure that we define as net income or loss plus adjustments for income taxes, depletion, depreciation and amortization, impairment expense,…
Cash Flow & Free Cash Flow Free Cash Flow and Projected Free Cash Flow Free Cash Flow does not represent funds available for future discretionary use because those funds are required for future debt service, capital expenditures,…
 Loading...