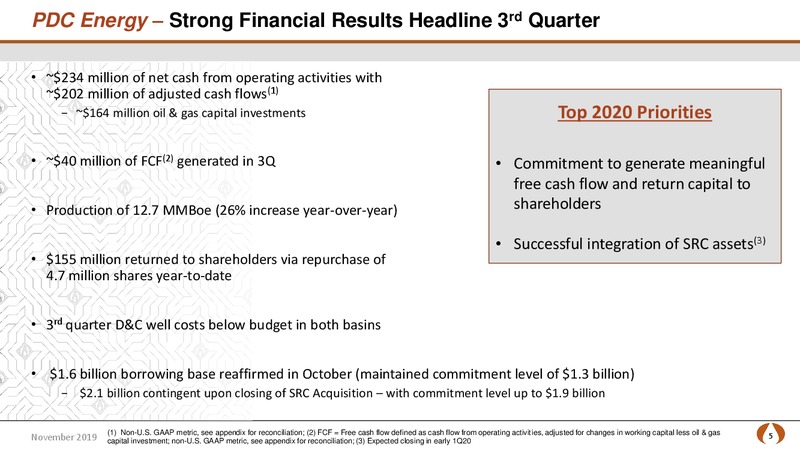
PDC Energy Strong Financial Results Headline 3rd Quarter 234 million of net cash from operating activities with 202 million of adjusted cash flows(1) 164 million oil & gas capital investments Top 2020 Priorities 40 million of FCF(2)…
2020 Priority Target FCF of 275 Million at 55 Oil & 2.70 Gas Pro Forma Contingent Upon Successful Closing of SRC Acquisition 2019 PDC Pro Forma Pro Forma Track Record Flexible Commodity of Execution Capital Program Price…
2020 Priority Successful Integration of SRC a a a PEOPLE PROCESS TECHNOLOGY Commitment to achieve 40 million of Integration Team assembled and Focus on optimizing field operations G&A synergies in 2020(1) planning transition…
SCOTT MEYERS Chief Financial Officer
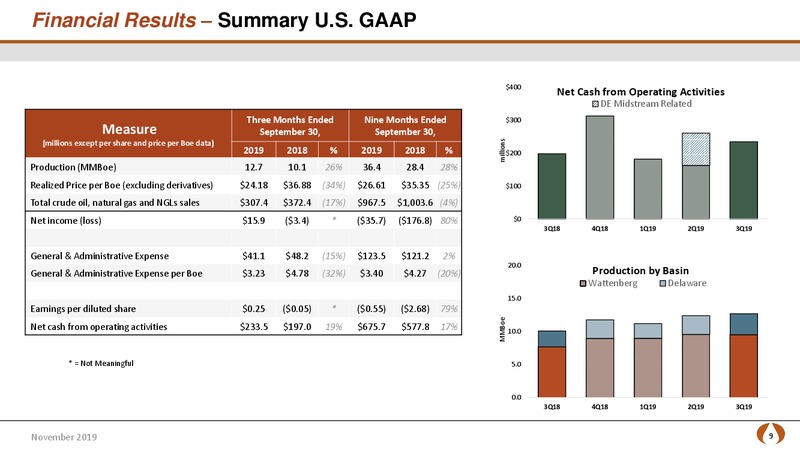
Financial Results Summary U.S. GAAP 400 Net Cash from Operating Activities DE Midstream Related Three Months Ended Nine Months Ended 300 Measure September 30, September 30, millions (millions except per share and price per…
Financial Results Summary Non-U.S. GAAP See Appendix for Reconciliation Adjusted EBITDAX(1) 300 80 Avg. NYMEX Oil Three Months Ended Nine Months Ended 250 70 Measure September 30, September 30, NYMEX Oil (/Bbl) (millions…
Financial Results Production Cost Summary Production Costs per Boe Three Months Ended Nine Months Ended 8 15 Measure September 30, September 30, Production Costs (per Boe) Production (MMBoe) 13 (millions except per share…
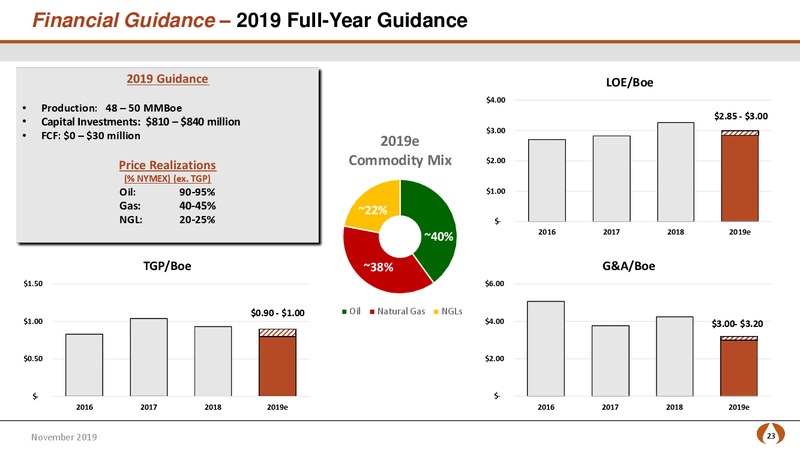
Financial Results Continued Focus on G&A Improvements Expect to meet updated 2019 G&A guidance of 3.00 - 3.20/Boe Includes all 1H19 expenses related to shareholder activism, Delaware midstream divestitures and PDC RIF-related…
Financial Overview Leverage, Liquidity & Hedge Position Overview As of September 30, 2019 Leverage and Liquidity Debt Maturity Schedule TTM leverage ratio of 1.5x (millions) 1,500 Total liquidity of 1.2 billion PDC borrowing base…
SCOTT REASONER Chief Operating Officer
Operations 3rd Quarter Highlighted by Reduced Well Costs 138,000 Production (Boe/d) 13% Oil Production Increase (3Q19 v 3Q18) Core Wattenberg Delaware Basin 96,000 net acres(1) 36,000 net acres(2) 1,150 DE Well Costs…
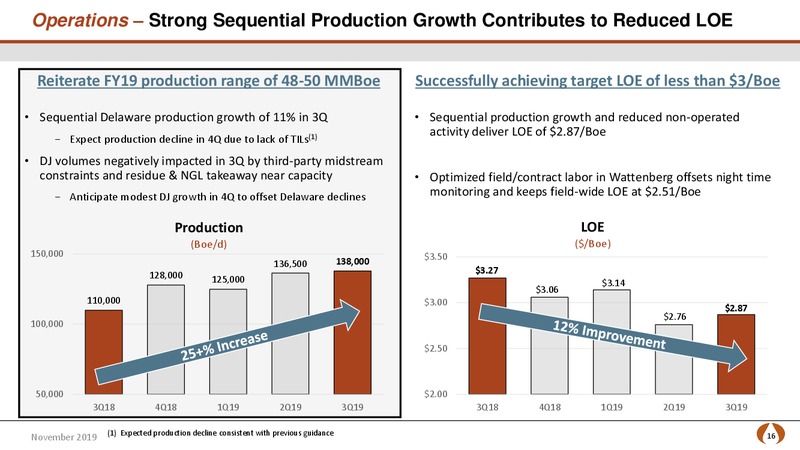
Operations Strong Sequential Production Growth Contributes to Reduced LOE Reiterate FY19 production range of 48-50 MMBoe Successfully achieving target LOE of less than 3/Boe Sequential Delaware production growth of 11% in 3Q…
Delaware Basin Capturing Efficiencies Throughout 2019 20+% improvement in 2019 drill times compared to 2018 3Q19 drilling cost per lateral foot is 31% better than 3Q18 4-well Buckskin pad (3Q19 TIL): Avg. peak 30-day IP of 225…
Delaware Basin Peer-Leading Cost Structure with Upside in 2020 2020 focus on pad drilling in Block 4 Currently project 25-30 spuds and TILs Line of sight on 10-15% year-over-year improvement in D&C costs in 2020 Equates to…
Wattenberg Improving Run-Times and Upcoming Expansion Offer Upside High line pressures reduce oil productivity on new and DCP Projected Processing & Bypass Expansion Timeline(1) legacy wells Throughput Details (MMcf/d) Fought…
Wattenberg Committed to Working Alongside COGCC and CDPHE CDPHE Study 2013-2016 air sampling data used to model & predict potential health impacts within 2,000 of an oil & gas well The study shows short-term exposuresduring worst-case…
Investor Relations Mike Edwards, Senior Director Investor Relations michael.edwardspdce.com Kyle Sourk, Manager Investor Relations kyle.sourkpdce.com Corporate Headquarters Website PDC Energy, Inc. www.pdce.com 1775 Sherman…
Reconciliation of Non-U.S. GAAP Financial Measures Adjusted Cash Flows from Operations and Free Cash Flow (Deficit) Three Months Ended September 30, Nine Months Ended September 30, 2019 2018 2019 2018 Adjusted cash flows from…
Reconciliation of Non-U.S. GAAP Financial Measures Adjusted EBITDAX Three Months Ended September 30, Nine Months Ended September 30, 2019 2018 2019 2018 Net income (loss) to adjusted EBITDAX: Net income (loss) 15.9 (3.4) (35.7)…
Reconciliation of Non-U.S. GAAP Metrics Beginning in 3Q19, the Company modified its adjusted EBITDAX reconciliation to exclude (Gain) loss on sale of properties and equipment Net income (loss) to adjusted EBITDAX (in millions): 3Q18…
 Loading...