NYSE: WMB williams.com WE MAKE ENERGY HAPPEN October 31, 2019 Williams 3rd Quarter 2019 Earnings Call
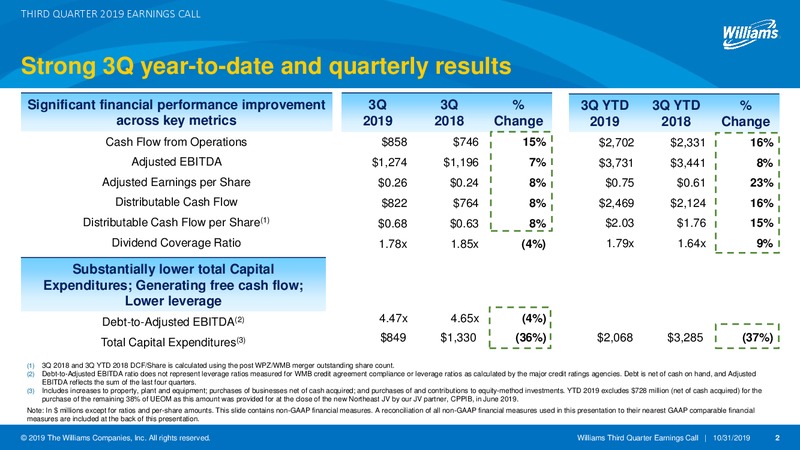
THIRD QUARTER 2019 EARNINGS CALL Strong 3Q year-to-date and quarterly results Significant financial performance improvement 3Q 3Q % 3Q YTD 3Q YTD % across key metrics 2019 2018 Change 2019 2018 Change Cash Flow from Operations 858…
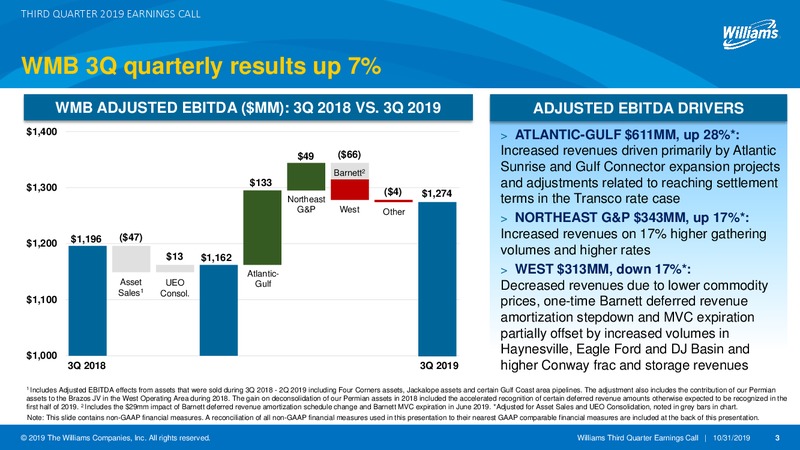
THIRD QUARTER 2019 EARNINGS CALL WMB 3Q quarterly results up 7% WMB ADJUSTED EBITDA (MM): 3Q 2018 VS. 3Q 2019 ADJUSTED EBITDA DRIVERS 1,400 ATLANTIC-GULF 611MM, up 28%*: 49 (66) Increased revenues driven primarily by Atlantic…
THIRD QUARTER 2019 EARNINGS CALL WMB 3Q year-to-date results up 8% WMB Adjusted EBITDA (MM): 3Q YTD 2018 vs. 3Q YTD 2019 ADJUSTED EBITDA DRIVERS 4,000 ATLANTIC-GULF 1,730MM, up 24%*: (87) Increased revenues driven primarily by…
THIRD QUARTER 2019 EARNINGS CALL WMB sequential quarter results up 3% WMB Adjusted EBITDA (MM): 2Q 2019 vs. 3Q 2019 ADJUSTED EBITDA DRIVERS 1,350 ATLANTIC-GULF 611MM, up 9%: Increased revenues due to adjustments related 24 (43)…
THIRD QUARTER 2019 EARNINGS CALL Key investor focus areas Reaffirming 19 financial Guidance; Providing 20 Guidance at Analyst Day December 5th Strong natural gas demand growth expected to drive 5-7% Adjusted EBITDA growth over the…
Questions 2019 The Williams Companies, Inc. All rights reserved. Williams Third Quarter Earnings Call 10/31/2019 7
Forward Looking Statements 2019 The Williams Companies, Inc. All rights reserved. Williams Third Quarter Earnings Call 10/31/2019 8
FORWARD-LOOKING STATEMENTS Forward-looking statements (contd) Risks associated with weather and natural phenomena, including climate conditions and physical damage to our facilities; Acts of terrorism, cybersecurity incidents, and…
Non-GAAP Reconciliations 2019 The Williams Companies, Inc. All rights reserved. Williams Third Quarter Earnings Call 10/31/2019 12
NON-GAAP RECONCILIATIONS Reconciliation of Income (Loss) Attributable to The Williams Companies, Inc. to Adjusted Income 2018 2019 (Dollars in millions, except per-share amounts) 1st Qtr 2nd Qtr 3rd Qtr 4th Qtr Year 1st Qtr 2nd Qtr…
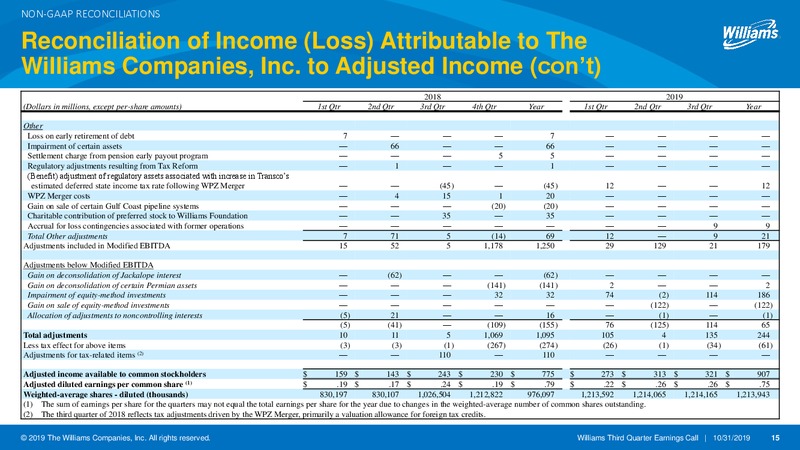
NON-GAAP RECONCILIATIONS Reconciliation of Income (Loss) Attributable to The Williams Companies, Inc. to Adjusted Income (cont) 2018 2019 (Dollars in millions, except per-share amounts) 1st Qtr 2nd Qtr 3rd Qtr 4th Qtr Year 1st Qtr 2nd…
NON-GAAP RECONCILIATIONS Reconciliation of Net Income to Modified EBITDA, Adjusted EBITDA and Distributable Cash Flow 2018 2019 (Dollars in millions, except coverage ratios) 1st Qtr 2nd Qtr 3rd Qtr 4th Qtr Year 1st Qtr 2nd Qtr 3rd Qtr…
NON-GAAP RECONCILIATIONS Reconciliation of Modified EBITDA to Non-GAAP Adjusted EBITDA 2018 2019 (Dollars in millions) 1st Qtr 2nd Qtr 3rd Qtr 4th Qtr Year 1st Qtr 2nd Qtr 3rd Qtr Year Net income (loss) 270 269 200 (546) 193 214 324…
 Loading...