U.S. Silica 2014 Wells Fargo Energy Symposium December 10, 2014
THE US SILICA STORY Outgrowing a Growth Market Adj. EBITDA Adj. EBITDA Market share Competitive growth expansion gain advantages 2009-2014E 2014-2017E per year 35% Strong 2X 1-2 CAGR points 3
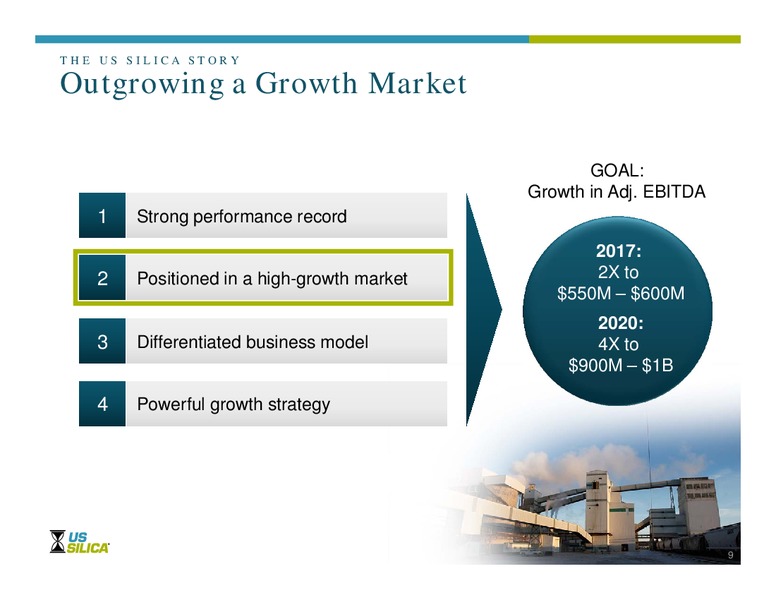
THE US SILICA STORY Outgrowing a Growth Market GOAL: Growth in Adj. EBITDA 1 Strong performance record 2017: 2X to 2 Positioned in a high-growth market 550M 600M 2020: 3 Differentiated business model 4X to 900M 1B 4 Powerful…
AT A GLANCE U.S. Silica Strength in Numbers Frac sand provider in world Top 3 Operating facilities 17 Tons of reserves 366M Annual production in 2013 (tons) 8.2M Growth rate doubling company size every 2-3 years Payback on…
Building on Two Strong, Complementary Business Segments Oil & Gas Proppants Industrial & Specialty (ISP) Revenue 347M Revenue 199M Segment margin % 42% Segment margin % 29% Segment contribution(1) 146M Segment contribution(1)…
Record of Meeting / Exceeding Our Goals 2013 Investor Day Goals for 2016 Accomplishments Double Adj. EBITDA by 2016 Expect to achieve in 2015 Gain 1 point of share per year Estimate 2 points gain in 2014 Add 10-20 new transloads…
THE US SILICA STORY Outgrowing a Growth Market GOAL: Growth in Adj. EBITDA 1 Strong performance record 2017: 2 Positioned in a high-growth market 2X to 550M 600M 2020: 3 Differentiated business model 4X to 900M 1B 4 Powerful…
Surging Demand for Oil & Gas Proppants Million Tons Proppant 80 2X 60 40 20 0 2010 2011 2012 2013 2014E 2015E 2016E Source: PacWest, Raymond James Ltd. 10
A CLOSER LOOK New Drilling Technique Leading to Exponential Growth in Demand New High Proppant Density Well Design* 2x stages per well 2x proppant consumption per stage Old = 4x consumption per well 2,000 New tons…
THE US SILICA STORY Outgrowing a Growth Market GOAL: Growth in Adj. EBITDA 1 Strong performance record 2017: 2 Positioned in a high-growth market 2X to 550M 600M 2020: 3 Differentiated business model 4X to 900M 1B 4 Powerful…
A Differentiated Business Model 1 Unmatched scale and resources 2 Expertise managing complexity Strong, sustainable 3 Best-in-class distribution competitive advantages 4 Attractive customer mix 5 Strong financial…
1. Unmatched Scale and Resources C A N A D A 17 operating facilities and 2 Greenfields 366M tons of high quality reserves 31 transload terminals Operating facilities Existing New Planned Transload terminals 14
2. Expertise Managing Complexity Its Not Just Sand Finding the right sand strict criteria set by the American Petroleum Institute (API) for strength, shape, solubility and flow Building the mine access to Class I rail, natural…
3. Best-in-Class Distribution Moving High Volumes Leverages our Unique of Proppant Supply Chain Example: Railcars and trucks needed to complete one well High velocity transloads 430 strategically located Economical silo inventory…
3. Best-in-Class Distribution Expertise Removing Transportation Bottlenecks Our Expertise Return railcar Mine / Railcar Rail Unload Transload Unload To well process transport to truck site 24 month Railroad Transload…
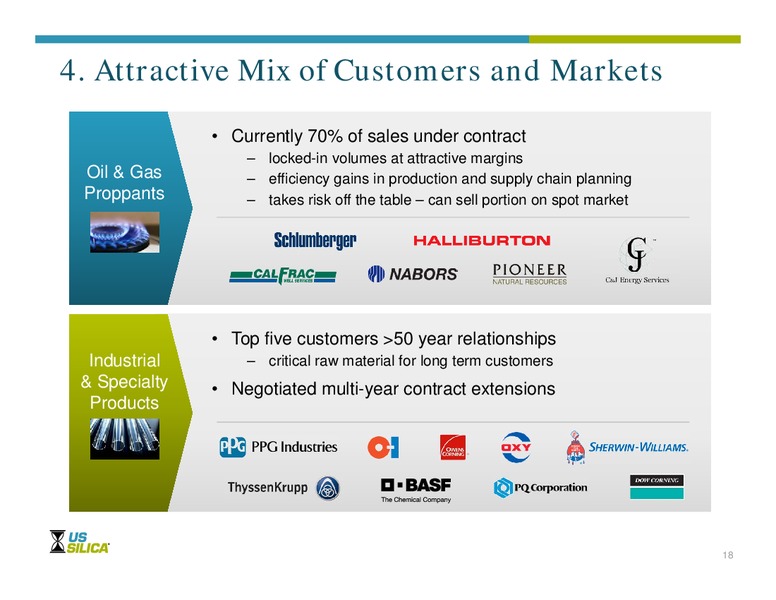
4. Attractive Mix of Customers and Markets Currently 70% of sales under contract locked-in volumes at attractive margins Oil & Gas efficiency gains in production and supply chain planning Proppants takes risk off the table can sell…
5. Strong Financial Position Almost all capex internally funded 100 Unlevered balance sheet Cash Flow debt to Adj. EBITDA 1.71 47M available 50 under revolver Total liquidity of 244M Capex as of Sept. 30, 2014 0 2011 2012…
THE US SILICA STORY Outgrowing a Growth Market GOAL: Growth in Adj. EBITDA 1 Strong performance record 2017: 2 Positioned in a high-growth market 2X to 550M 600M 2020: 3 Differentiated business model 4X to 900M 1B 4 Powerful…
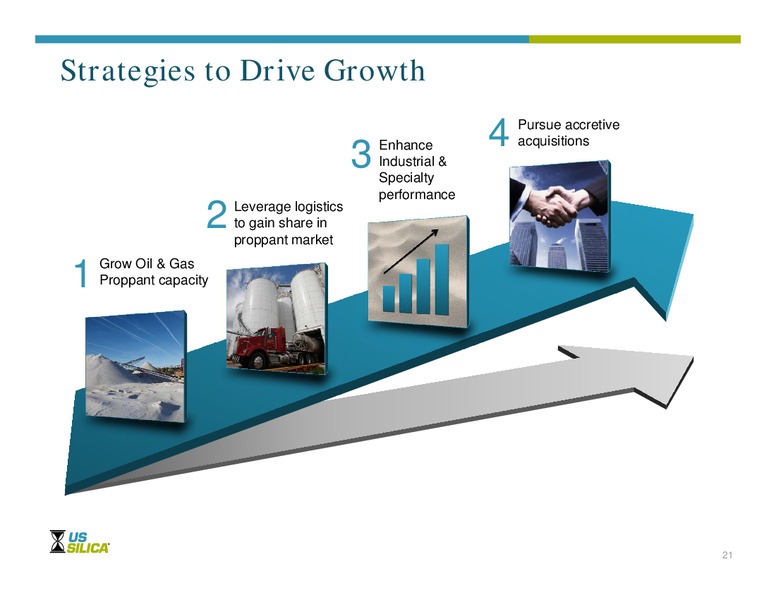
Strategies to Drive Growth 4 Pursue accretive 3 Enhance acquisitions Industrial & Specialty performance 2 Leverage logistics to gain share in proppant market 1 Grow Oil & Gas Proppant capacity 21
GROWTH STRATEGY 1 Build Capacity Continue to Outgrow the Market Index of Production US Silica growth Based on 2011 Volume = 100 800 40%+ Potential greenfield 3M CAGR New plant / expansion 700 Fairchild 3M 600 Market Pacific…
GROWTH STRATEGY 2 Expand and Leverage Distribution Network Facilities in the right places, with the right products, at the best price Expanding network to 40 transloads by 2016 4 new transloads and 5 expansions planned for 2015…
GROWTH STRATEGY 3 Enhance Industrial & Specialty Performance Investing in Innovation Introducing higher-margin, value added specialty products 37 investing 1.5-2M/year in R&D Optimizing product mix Growing base 4% per year…
GROWTH STRATEGY 4 Pursue Greenfield Opportunities, Acquisitions New Fairchild Wisconsin Cadre Greenfield Site Acquisition Starting development of 800K tons annually 3M ton per year, low-cost facility Regional frac sand producer on…
Roadmap to Adjusted EBITDA of 550-600M by 2017 550M- 600M ISP new products and growth Potential greenfield 2 230M- Fairchild 240M Pacific 2016 expansion Full run-rate start-up Rochelle, Utica and Cadre 2015 start-up…
MID-TERM OUTLOOK Long Growth Runway Key Drivers Continued strong unconventional drilling activity in major shale basins Continued trend of more frac sand per well to enhance recoveries Bring on one new 3M ton per year mine /…
IN SUMMARY U.S. Silica Outgrowing a Growth Market GOAL: Growth in Adj. EBITDA 1 Strong performance record 2017: 2 Positioned in a high-growth market 2X to 550M 600M 2020: 3 Differentiated business model 4X to 900M 1B 4…
Reconciliation (Adjusted EBITDA to Net Income) The following table sets forth a reconciliation of net income, the most directly comparable GAAP financial measure, to Adjusted EBITDA. Year Ended December 31, 2013 2010 Net income 72,256…
 Loading...