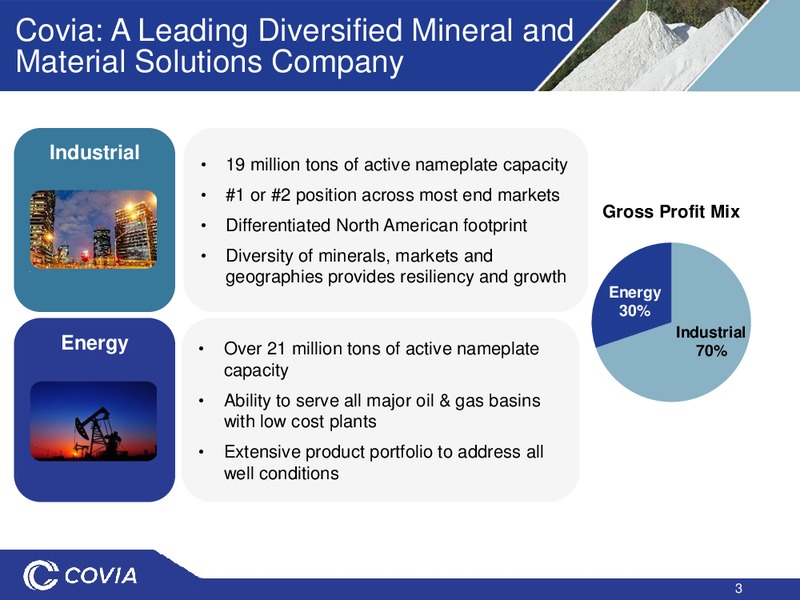
Covia: A Leading Diversified Mineral and Material Solutions Company Industrial 19 million tons of active nameplate capacity 1 or 2 position across most end markets Gross Profit Mix Differentiated North American footprint Diversity…
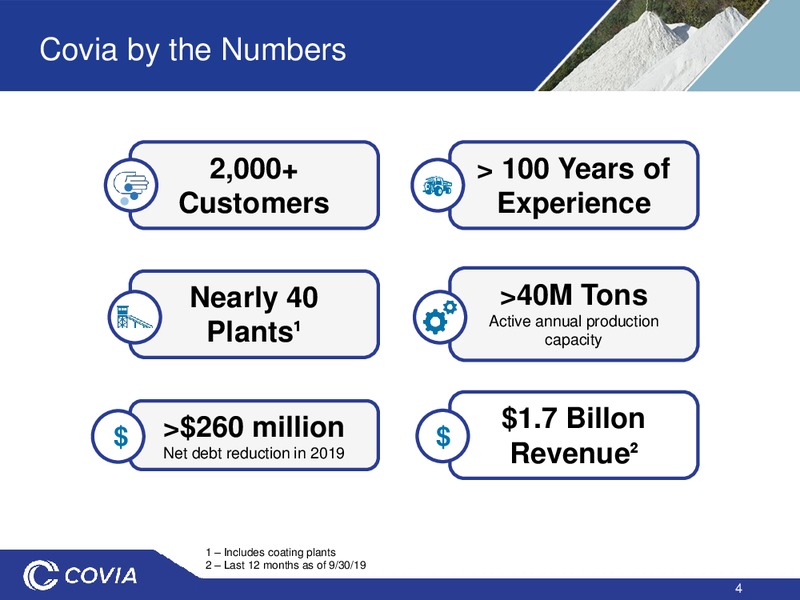
Covia by the Numbers 2,000+ 100 Years of Customers Experience Nearly 40 40M Tons Active annual production Plants capacity 260 million 1.7 Billon Net debt reduction in 2019 Revenue 1 Includes coating plants 2 Last 12…
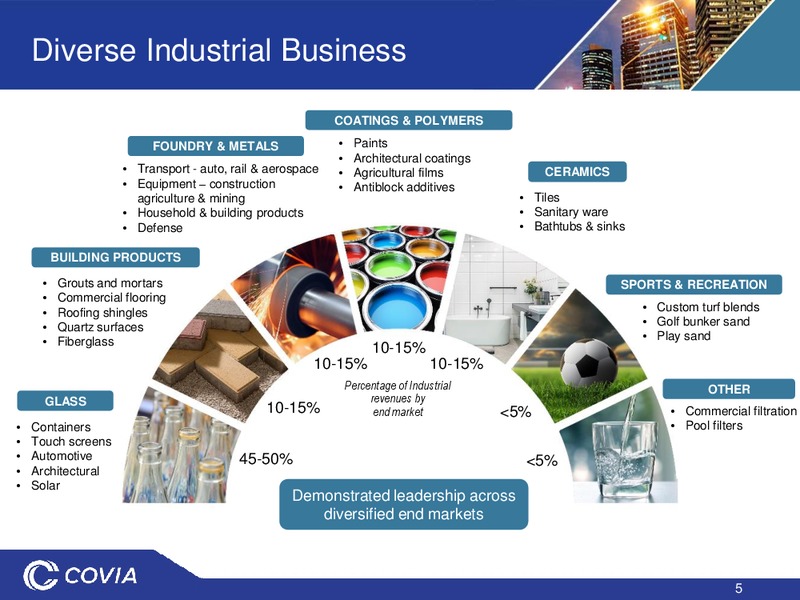
Diverse Industrial Business COATINGS & POLYMERS FOUNDRY & METALS Paints Architectural coatings Transport - auto, rail & aerospace Agricultural films CERAMICS Equipment construction Antiblock additives agriculture & mining Tiles…
Energy Segment Matched to Market Resin Coated Mine Drilling Raw Sand to Well Products Sand Size and Scale Well Cementing Additives & Northern White Local In-Basin Curable & Tempered Last Mile Gravel Packing Sand High-quality…
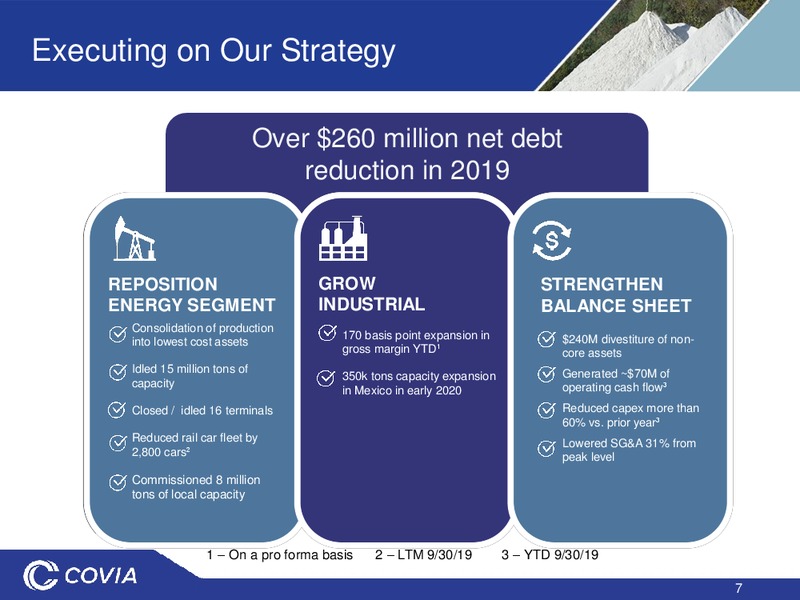
Executing on Our Strategy Over 260 million net debt reduction in 2019 REPOSITION GROW STRENGTHEN ENERGY SEGMENT INDUSTRIAL BALANCE SHEET Consolidation of production 170 basis point expansion in 240M divestiture of non- into…
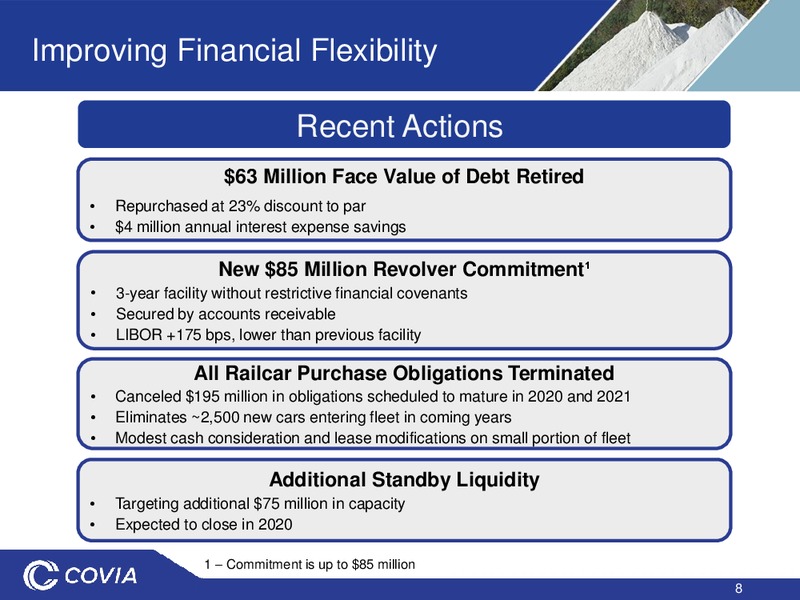
Improving Financial Flexibility Recent Actions 63 Million Face Value of Debt Retired Repurchased at 23% discount to par 4 million annual interest expense savings New 85 Million Revolver Commitment 3-year facility without…
Financial Transition Slide FINANCIALS and OUTLOOK
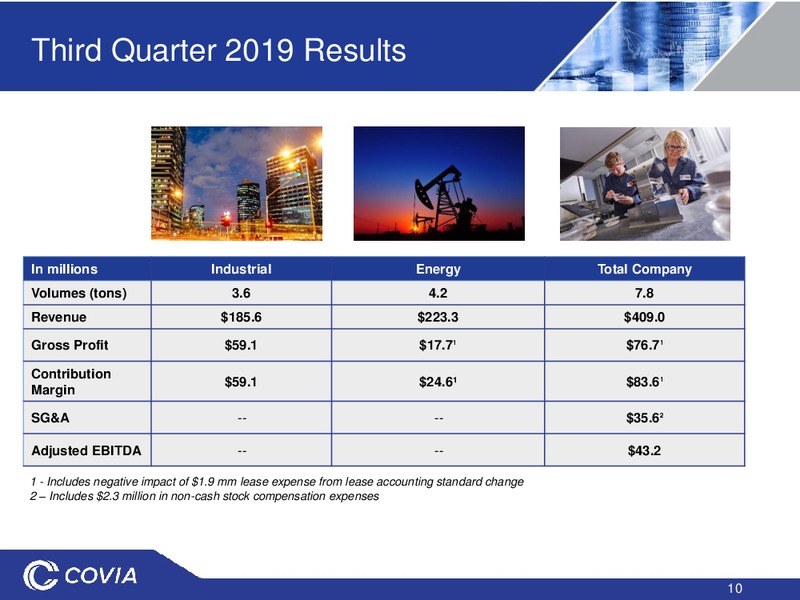
Third Quarter 2019 Results In millions Industrial Energy Total Company Volumes (tons) 3.6 4.2 7.8 Revenue 185.6 223.3 409.0 Gross Profit 59.1 17.7 76.7 Contribution 59.1 24.6 83.6 Margin SG&A -- -- 35.6 Adjusted EBITDA -- --…
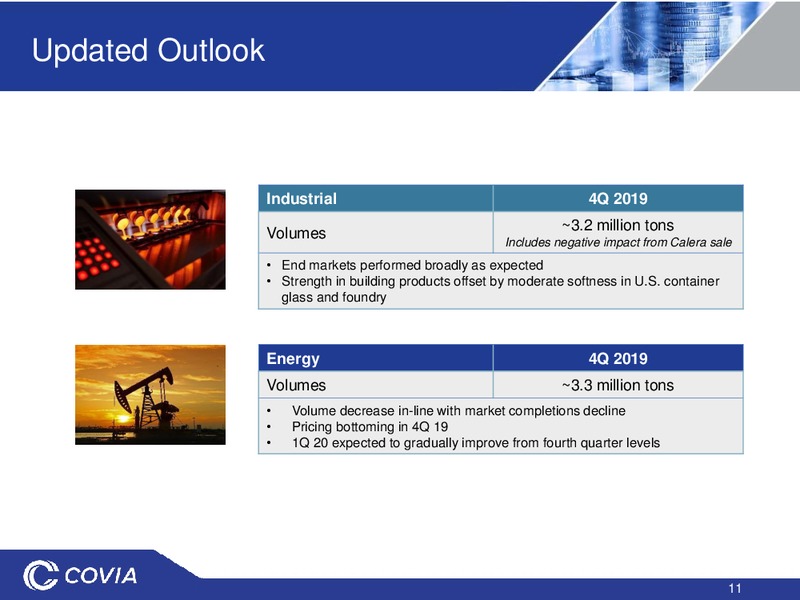
Updated Outlook Industrial 4Q 2019 Volumes 3.2 million tons Includes negative impact from Calera sale End markets performed broadly as expected Strength in building products offset by moderate softness in U.S. container glass…
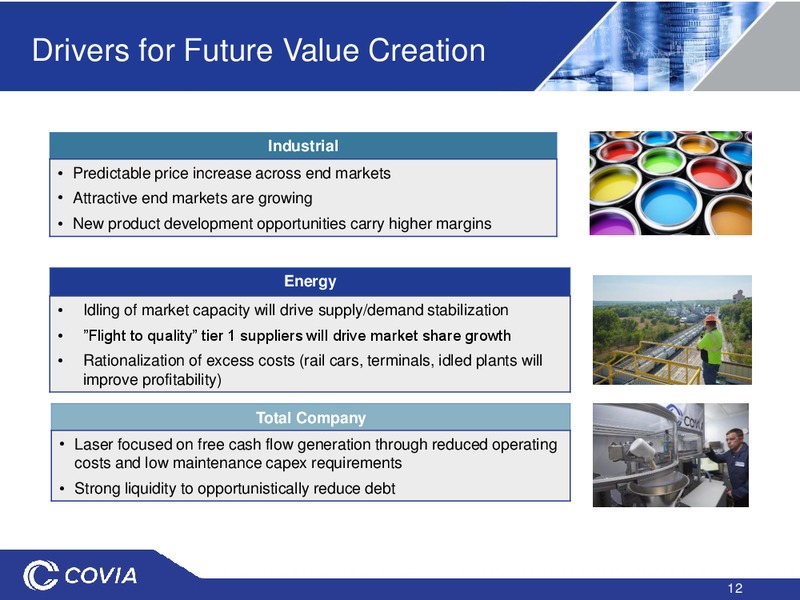
Drivers for Future Value Creation Industrial Predictable price increase across end markets Attractive end markets are growing New product development opportunities carry higher margins Energy Idling of market capacity will drive…
Appendix
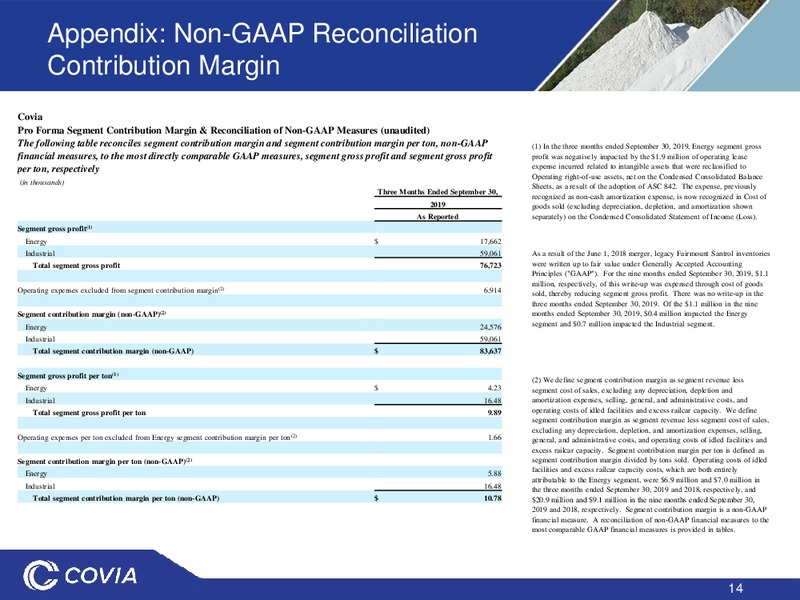
Appendix: Non-GAAP Reconciliation Contribution Margin Covia Pro Forma Segment Contribution Margin & Reconciliation of Non-GAAP Measures (unaudited) The following table reconciles segment contribution margin and segment contribution…
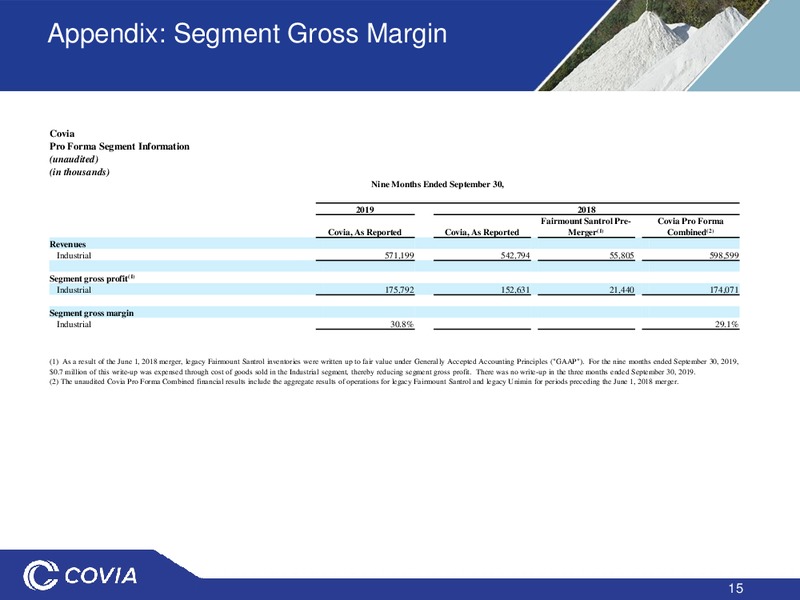
Appendix: Segment Gross Margin Covia Pro Forma Segment Information (unaudited) (in thousands) Nine Months Ended September 30, 2019 2018 Fairmount Santrol Pre- Covia Pro Forma Covia, As Reported Covia, As Reported Merger(1)…
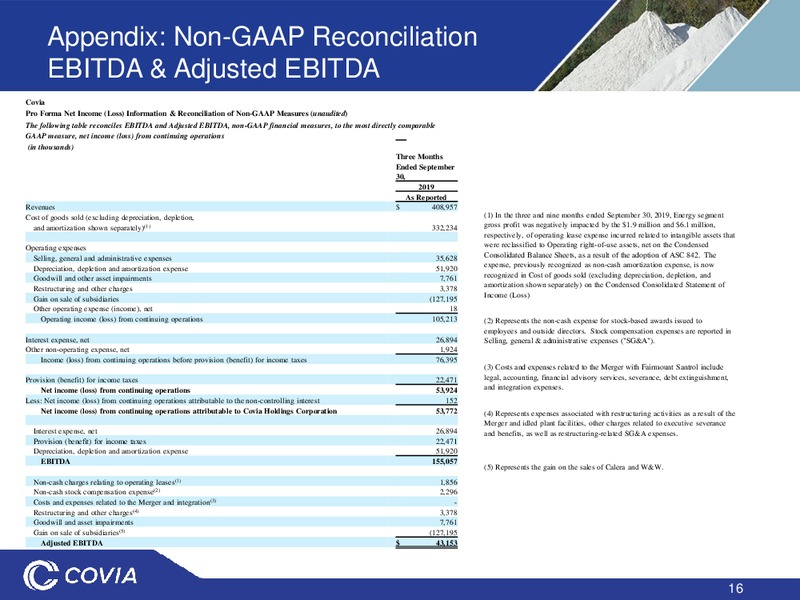
Appendix: Non-GAAP Reconciliation EBITDA & Adjusted EBITDA Covia Pro Forma Net Income (Loss) Information & Reconciliation of Non-GAAP Measures (unaudited) The following table reconciles EBITDA and Adjusted EBITDA, non-GAAP financial…
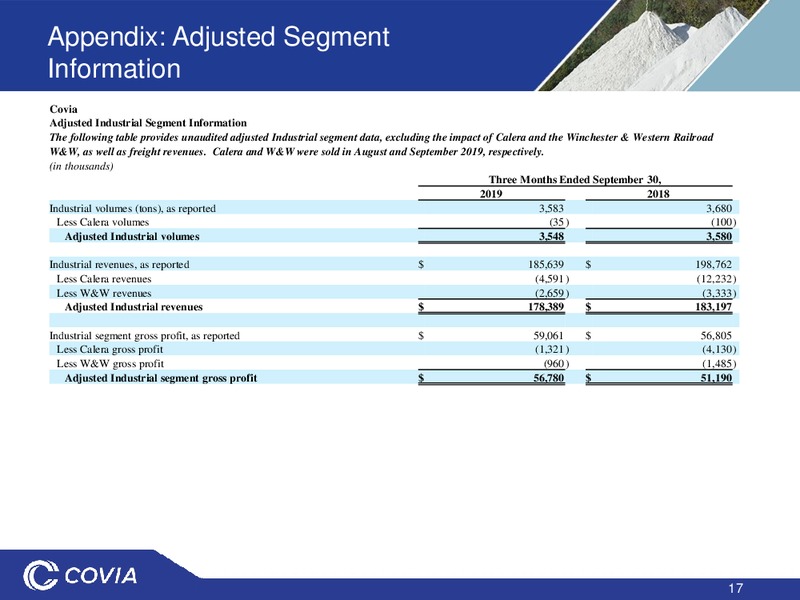
Appendix: Adjusted Segment Information Covia Adjusted Industrial Segment Information The following table provides unaudited adjusted Industrial segment data, excluding the impact of Calera and the Winchester & Western Railroad W&W, as…
 Loading...