A leading North American energy infrastructure company Proven strategy with a low-risk business model Delivered 14% average annual total shareholder return since 2000 Business performing very well Record financial results expected…
TC Energy today One of North Americas largest natural gas pipeline networks 92,600 km (57,500 mi) of pipeline 653 Bcf of storage capacity 23 Bcf/d; 25% of continental demand Premier liquids pipeline system 4,900 km (3,000 mi) of…
Major 2019 Accomplishments Generated record financial results through the first nine months Comparable earnings were 3.11 per share, up 10 per cent Comparable funds generated from operations of 5.3 billion, up 14 per cent Advanced 30…
Financial highlights Nine months ended September 30 (Non-GAAP) Comparable Comparable Comparable funds earnings per common share* EBITDA* generated from operations* (Dollars) (Millions) (Millions) 10% increase 15% increase 14%…
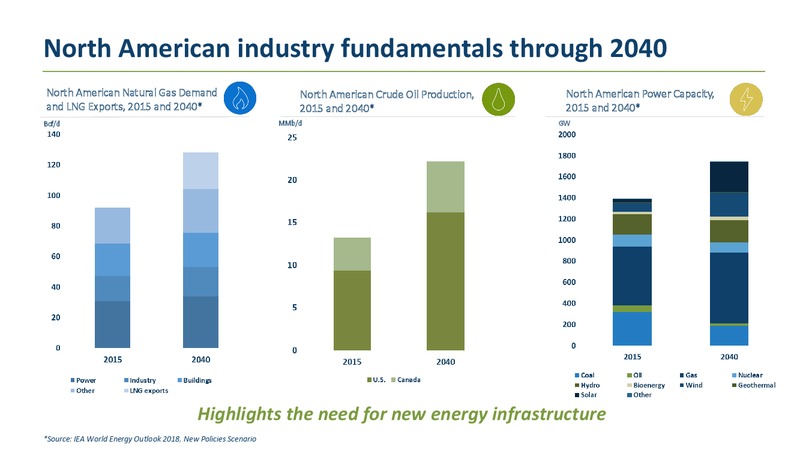
North American industry fundamentals through 2040 North American Natural Gas Demand North American Crude Oil Production, North American Power Capacity, and LNG Exports, 2015 and 2040* 2015 and 2040* 2015 and 2040* Bcf/d MMb/d GW…
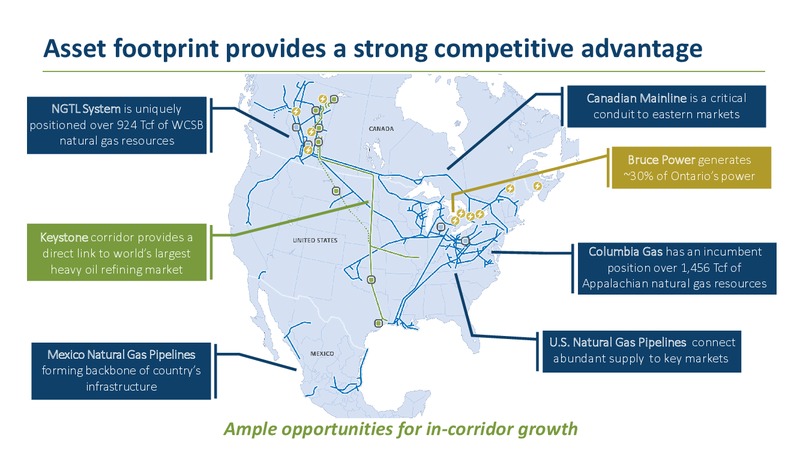
Asset footprint provides a strong competitive advantage Canadian Mainline is a critical NGTL System is uniquely conduit to eastern markets positioned over 924 Tcf of WCSB natural gas resources Bruce Power generates 30% of Ontarios…
Line of sight to over 50 billion of growth opportunities Natural Gas Pipelines Liquids Pipelines Power and Storage NGTL expansions Keystone XL Bruce Power Life Extension Columbia expansions Grand Rapids Phase II Other growth in…
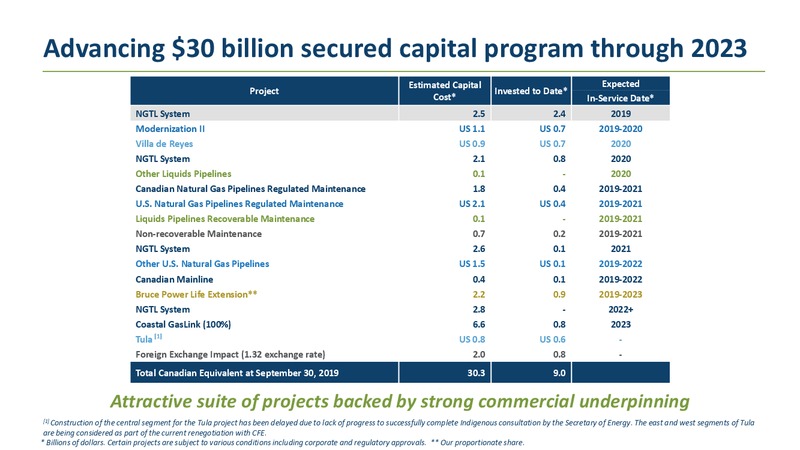
Advancing 30 billion secured capital program through 2023 Estimated Capital Expected Project Invested to Date* Cost* In-Service Date* NGTL System 2.5 2.4 2019 Modernization II US 1.1 US 0.7 2019-2020 Villa de Reyes US 0.9 US 0.7…
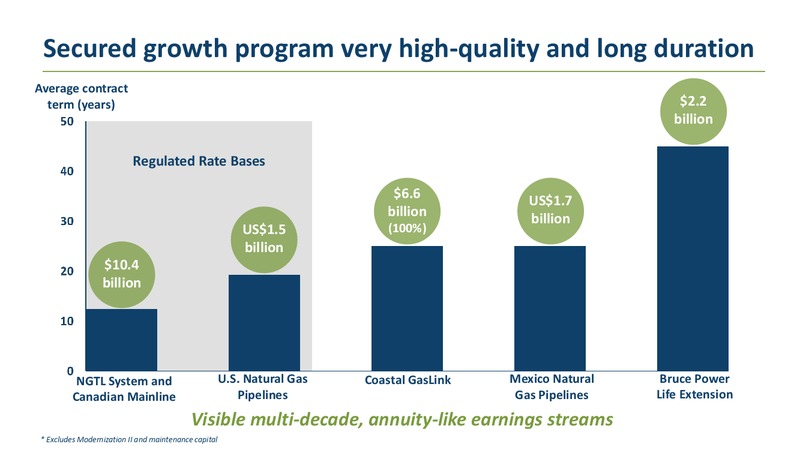
Secured growth program very high-quality and long duration Average contract term (years) 2.2 billion Regulated Rate Bases 6.6 US1.7 billion billion US1.5 (100%) billion 10.4 billion NGTL System and U.S. Natural Gas…
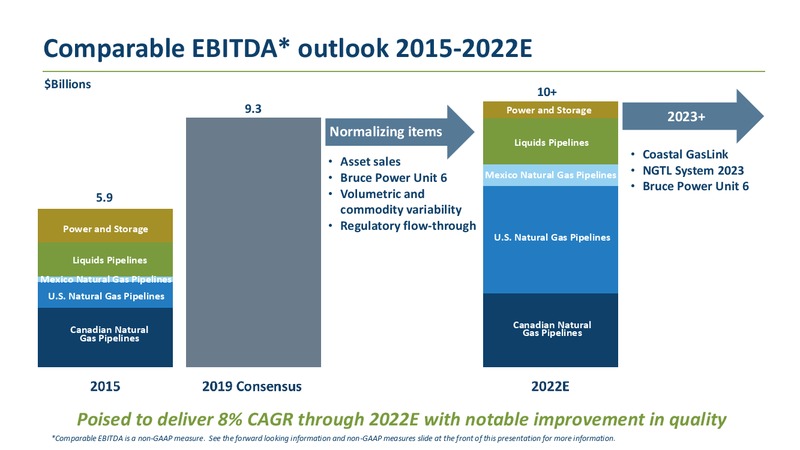
Comparable EBITDA* outlook 2015-2022E Billions 10+ 9.3 Power and Storage 2023+ Normalizing items Liquids Pipelines Coastal GasLink Asset sales NGTL System 2023 Bruce Power Unit 6 Mexico Natural Gas Pipelines Bruce Power Unit 6…
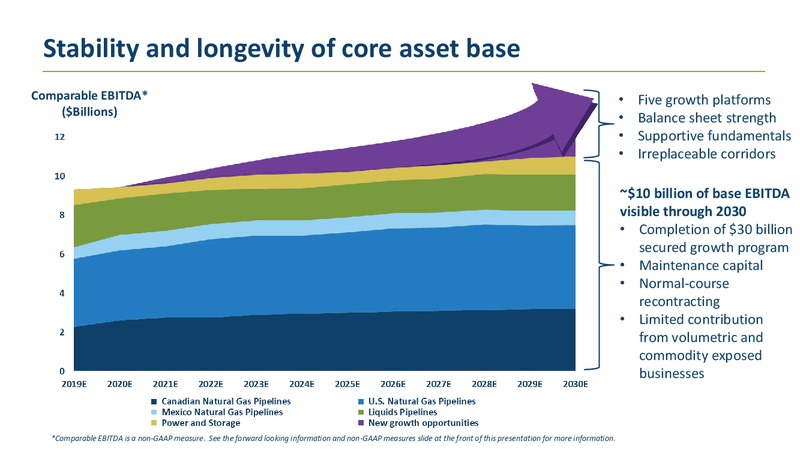
Stability and longevity of core asset base Comparable EBITDA* Five growth platforms (Billions) Balance sheet strength Supportive fundamentals Irreplaceable corridors 10 billion of base EBITDA visible through 2030 Completion of 30…
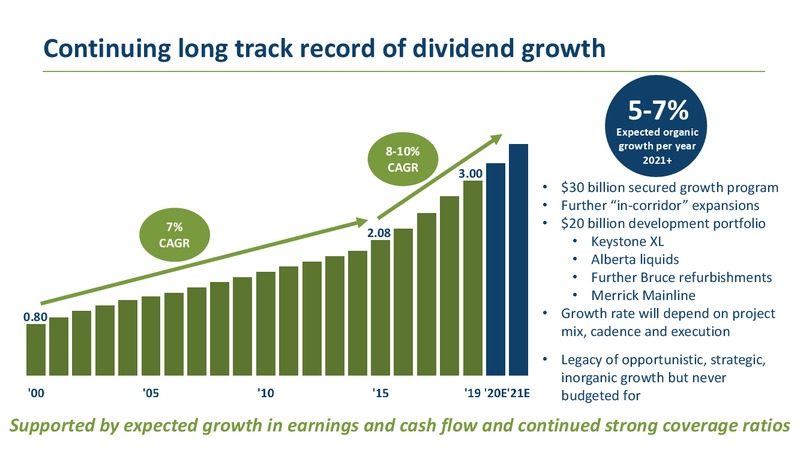
Continuing long track record of dividend growth 5-7% Expected organic growth per year 8-10% 2021+ CAGR 3.00 30 billion secured growth program Further in-corridor expansions 7% 20 billion development portfolio 2.08 CAGR…
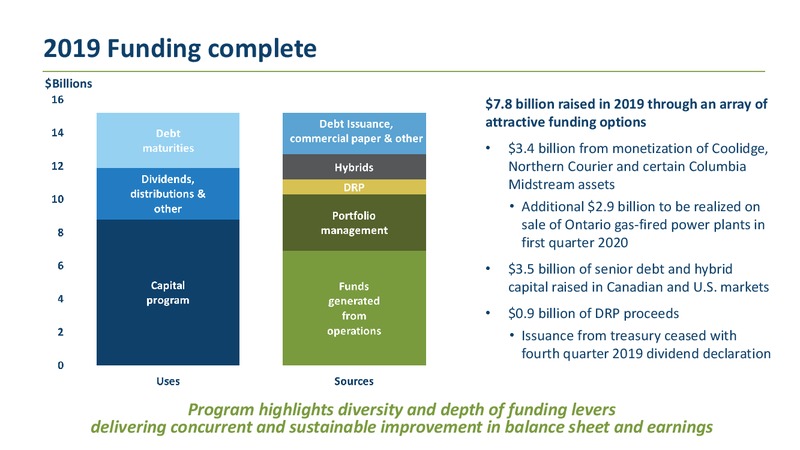
2019 Funding complete Billions 7.8 billion raised in 2019 through an array of attractive funding options 3.4 billion from monetization of Coolidge, Northern Courier and certain Columbia Midstream assets Additional 2.9 billion to be…
Balanced program has funded 72 billion of capital needs Billions 2016-2019E Portfolio Management Acquisitions Discrete Equity ATM Debt Maturities Hybrid Securities & DRP Senior Debt, Preferred Shares Commercial Paper & Cash…
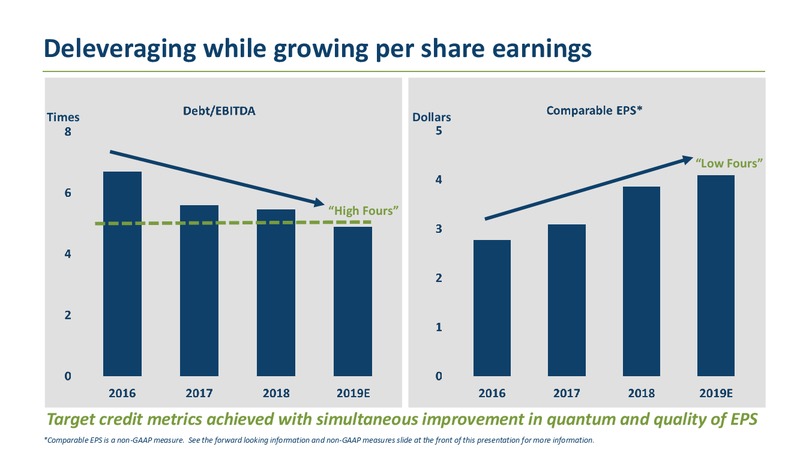
Deleveraging while growing per share earnings Times Dollars Low Fours High Fours Target credit metrics achieved with simultaneous improvement in quantum and quality of EPS *Comparable EPS is a non-GAAP measure. See the forward…
Capital expenditure outlook 2020-2022 Billions Secured growth portfolio 7.2 Coastal GasLink contributions 6.2 assume 25% ownership and project-level construction 4.6 financing Maintenance capital 90% has opportunity to earn a…
Funding program outlook 2020-2022 Billions Numerous levers available Debt issuance, Strong, predictable and growing cash commercial paper and other flow from operations Dividends, Ontario natural distributions and gas-fired power…
Debt maturity profile 2020-2022 Billions Solid liquidity and market access 10 billion of committed and undrawn credit lines Well supported commercial paper programs Canada 2.0 billion U.S. US3.5 billion Shelf facilities in place…
Unparalleled footprint is a competitive advantage High-quality asset footprint cannot be replicated 92,600 km (57,500 mi) of natural gas WCSB pipelines 653 Bcf of storage capacity Access to abundant, cost-competitive supply Assets…
Abundant, low-cost supply WCSB 2007 - 165 Tcf North American resource estimate has 2019 - 924 Tcf grown over 250% since 2007 Over 100 years of recoverable supply Rockies / San Juan WCSB and Appalachia are the fastest- 2007 - 354…
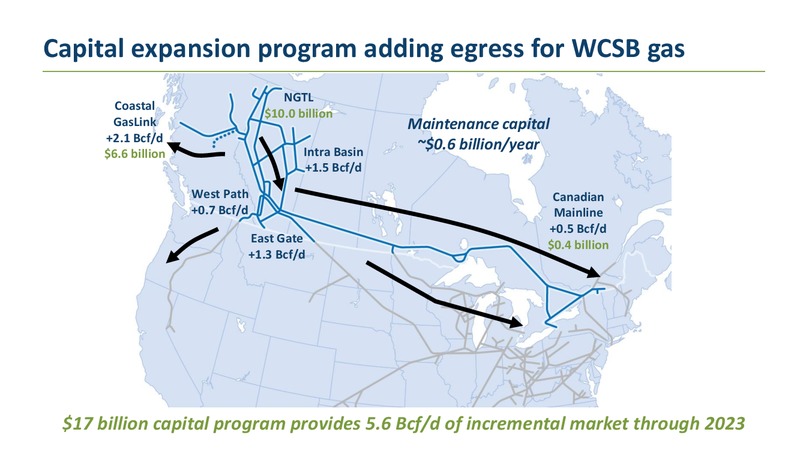
Capital expansion program adding egress for WCSB gas NGTL Coastal 10.0 billion GasLink Maintenance capital +2.1 Bcf/d Intra Basin 0.6 billion/year 6.6 billion +1.5 Bcf/d West Path Canadian +0.7 Bcf/d Mainline +0.5 Bcf/d East…
Expanding WCSB access to market NGTL 10 billion capital program underway Expand access to markets and reduce system constraints Increase access to low-cost North Montney supply Continue to facilitate growth of local markets Advance…
Expanding WCSB access to market Coastal GasLink 6.6 billion capital cost Initial capacity of 2.1 Bcf/d expandable to 5 Bcf/d Fully permitted Signed Project Agreements with 20 First Nations along the right of way Construction…
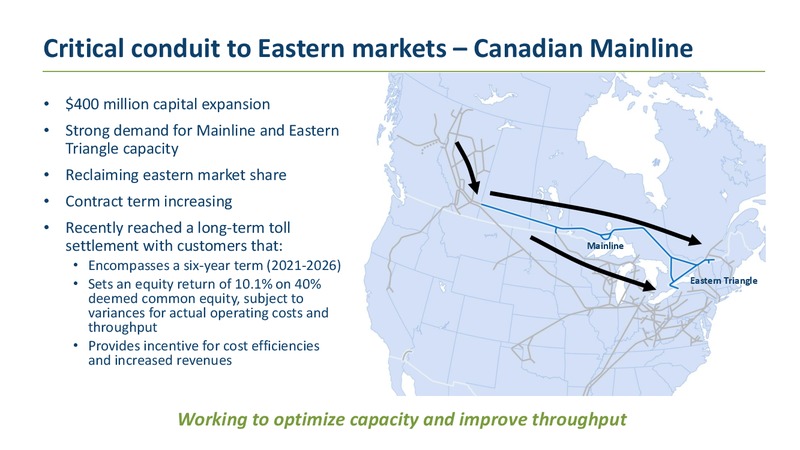
Critical conduit to Eastern markets Canadian Mainline 400 million capital expansion Strong demand for Mainline and Eastern Triangle capacity Reclaiming eastern market share Contract term increasing Recently reached a long-term toll…
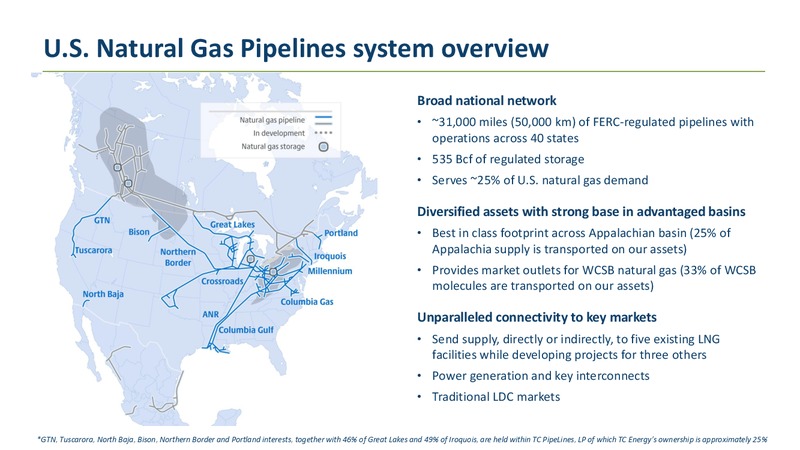
U.S. Natural Gas Pipelines system overview Broad national network 31,000 miles (50,000 km) of FERC-regulated pipelines with operations across 40 states 535 Bcf of regulated storage Serves 25% of U.S. natural gas demand Diversified…
Pipelines experiencing record demand Pipeline* Contracted Capacity GTN 100% Northern Border 100% Millennium 100% Columbia Gulf 100% Portland 100% North Baja 100% ANR 100% Tuscarora 100% Columbia Gas 93% Iroquois…
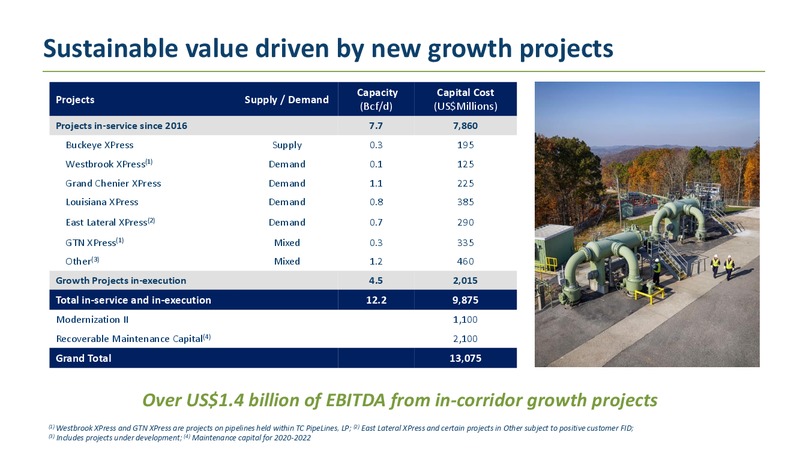
Sustainable value driven by new growth projects Capacity Capital Cost Projects Supply / Demand (Bcf/d) (USMillions) Projects in-service since 2016 7.7 7,860 Buckeye XPress Supply 0.3 195 Westbrook XPress(1) Demand 0.1 125 Grand…
Accessing global demand via LNG exports LNG Facilities supplied by TC Energy: Operational LNG Facility LNG Facility under construction LNG Facility under development (FID pending) Our U.S. pipelines provide supply to five existing…
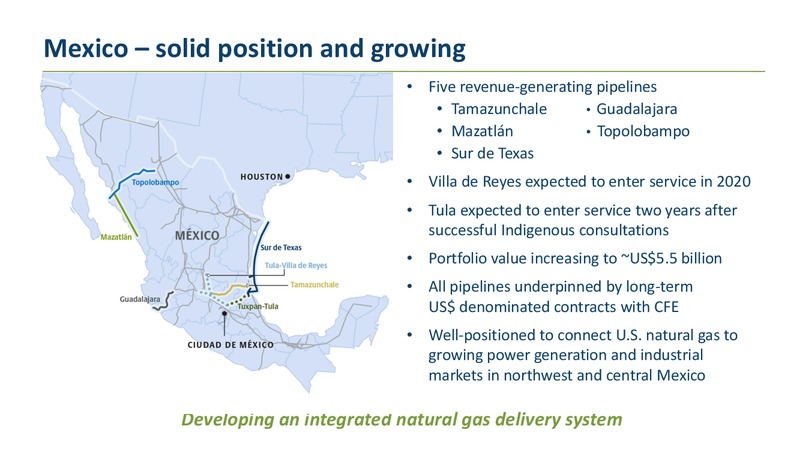
Mexico solid position and growing Five revenue-generating pipelines Tamazunchale Guadalajara l Mazatln Topolobampo l Sur de Texas Villa de Reyes expected to enter service in 2020 Tula expected to enter service two years…
Mexico growth potential Short-term growth Increasing capacity through efficient expansions Connecting new demand centres through extensions Central: Abundant U.S. gas enabling industrial and power generation fuel switching…
Liquids Pipelines connecting North American supply to markets Keystone Pipeline System Transports 20% of Western Canadian crude oil exports Delivers U.S. production to market Market access to 6 million Bbl/d of refining capacity…
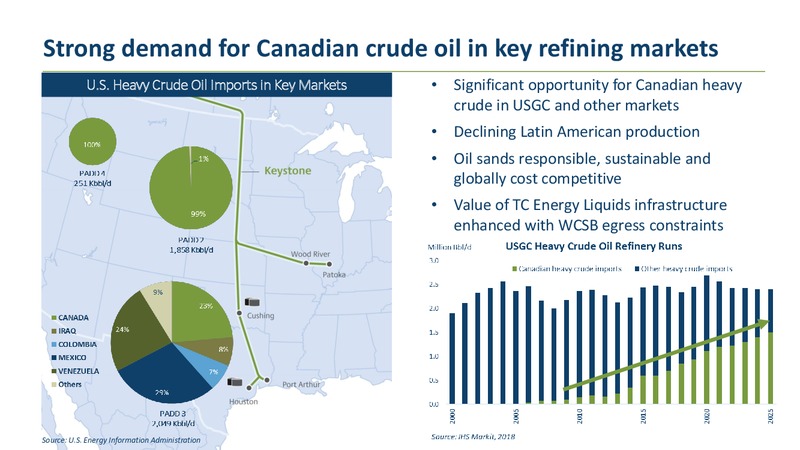
Strong demand for Canadian crude oil in key refining markets U.S. Heavy Crude Oil Imports in Key Markets Significant opportunity for Canadian heavy crude in USGC and other markets Declining Latin American production Oil sands…
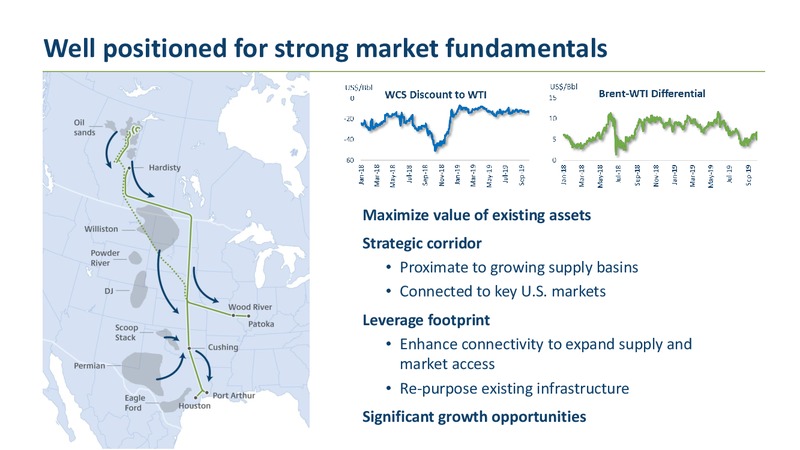
Well positioned for strong market fundamentals Maximize value of existing assets Strategic corridor Proximate to growing supply basins Connected to key U.S. markets Leverage footprint Enhance connectivity to expand supply and…
Progressing Keystone XL Canadian NEB approved U.S. federal permit status New Presidential Permit issued Final SEIS issued Other federal permits expected in early 2020 State-level permit status Nebraska Public Service Commission…
Power and Storage asset overview Power 10 power plants* Approximately 6,000 MW* Portfolio of low-cost, low-emission, baseload generation Underpinned by long-term contracts Storage Alberta non-regulated natural gas storage…
Assets deliver high-quality EBITDA Long-term contracted Plant Counterparty Contract expiry capacity (MW)* Bruce Power Units 1-8 3,109 IESO Up to 2064 Bcancour 550 Hydro-Qubec 2026 Alberta plants 127 various 2022-2027 Grandview 90…
Bruce Power overview 6,400 MW or 30% of Ontarios needs 48.4% ownership interest Power sales contracted with Ontario IESO through 2064 Ontario Power Generation responsible for spent fuel and decommissioning liabilities Unit 1…
Bruce Power Life Extension Program Major Component Replacement (MCR) and Asset Management (AM) on schedule and on budget Unit 6 MCR to begin in January 2020 MCR and AM capital reflected in power price Price increased from 68/MWh to…
Financial principles Adherence to Long-term view grounded in established, conservative risk Simple model and fundamentals preferences corporate structure Footprint is irreplaceable Assets are resilient and earn Business is…
Diversified portfolio of critical energy infrastructure 2019E Comparable EBITDA* Multiple business lines Foreign Exchange EBITDA 60% USD and 40% CAD Significant U.S. dollar debt and associated interest serve as natural hedge…
Proven capital allocation framework delivers results 40% Critical energy infrastructure assets generate stable, long-term cash flow streams 60% Growing dividends Disciplined investment in supported by strong complementary…
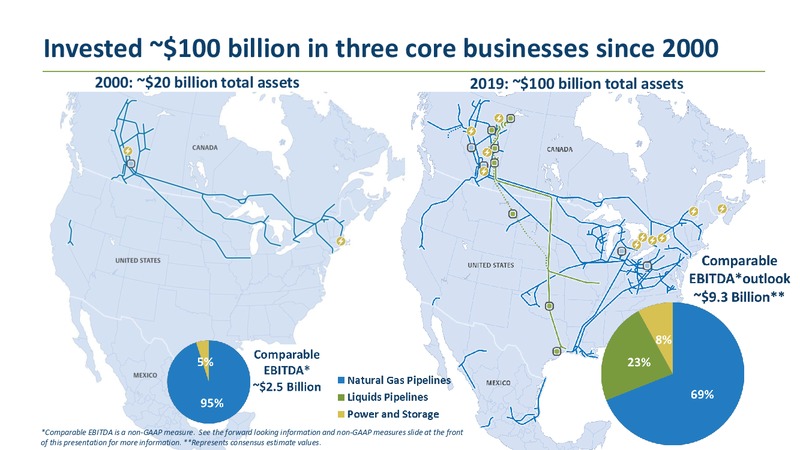
Invested 100 billion in three core businesses since 2000 2000: 20 billion total assets 2019: 100 billion total assets *Comparable EBITDA is a non-GAAP measure. See the forward looking information and non-GAAP measures slide at the…
Investment has created significant value Dollars Dollars 7% 6% CAGR CAGR Substantial growth in earnings and cash flow per share *Comparable earnings per common share and comparable funds generated from operations per common…
Low-risk business model has consistently produced results Dollars MLP Oil Supported by distress price Strong business fundamentals collapse Shale Regulated assets Financial crisis revolution Long-term contracts IPP downfall…
Nineteen consecutive years of common share dividend increases 7% CAGR Supported by growth in earnings and cash flow and strong coverage ratios
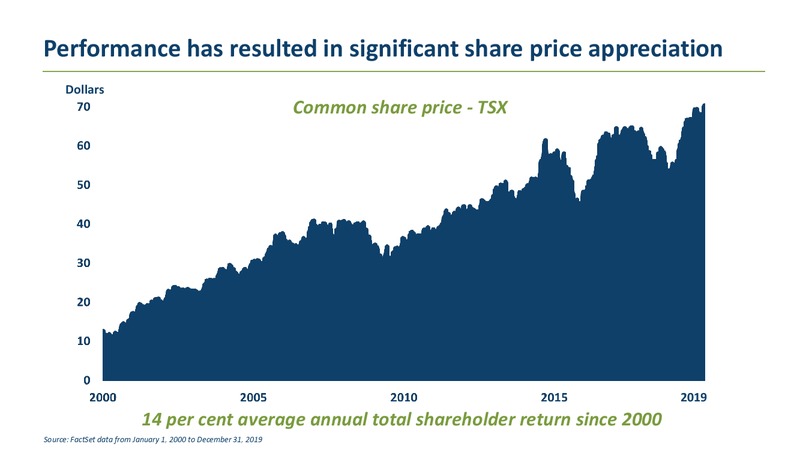
Performance has resulted in significant share price appreciation Dollars Common share price - TSX 2019 14 per cent average annual total shareholder return since 2000 Source: FactSet data from January 1, 2000 to December 31, 2019
E S G Environmental, Social and Governance commitment Safety and reliability are critical priorities Operating objectives, targets and results Zero is real Long history of working collaboratively with stakeholders Customers,…
E S G Delivering the energy people need, every day Investing over 1 billion annually in pipeline integrity Monitoring pipelines 24 hours a day from control centres Conducting over 100 emergency response training exercises each…
Corporate Profile January 2020
Appendix Reconciliation of non-GAAP measures (millions of dollars, except per share amounts) Three months ended September 30 Nine months ended September 30 2019 2018 2019 2018 Net Income Attributable to Common Shares 739 928 2,868…
Appendix Reconciliation of non-GAAP measures continued (millions of dollars) Three months Nine months ended September 30 ended September 30 2019 2018 2019 2018 Comparable EBITDA(1) 2,344 2,056 7,051 6,110 Depreciation and…
Appendix Reconciliation of non-GAAP measures continued (millions of dollars) Three months Nine months ended September 30 ended September 30 2019 2018 2019 2018 Net Cash Provided by Operations 1,585 1,299 5,256 4,516…
 Loading...