Agenda Highlights Update on merger Update on financial situation Financial results Strategy & Summary 3
Highlights Q4 2019 Utilisation of 23% in Q4, and 50.9% for the year 2019 Financial results Reported EBITDA was a loss of USD 6.4 million. Underlying EBITDA in the quarter adjusted for non- recurring items was a loss of USD 0.4…
Agenda Highlights Update on merger Update on financial situation Financial results Strategy & Summary 5
Update on merger process with Floatel Merger among equals agreement with Floatel International Ltd. announced in June 2019. Agreed exchange ratio in an all share transaction is 55/45 (PRS/FIL) on a fully diluted basis. The long stop…
Agenda Highlights Update on merger Update on financial situation Financial results Strategy & Summary 7
Update on financial situation On 5 November 2019, Prosafe announced that an impairment charge of USD 341 million had been made to the book value of vessels as a consequence of a prolonged industry downturn and weaker outlook in the…
Agenda Highlights Update on merger Update on financial situation Financial results Strategy & Summary 9
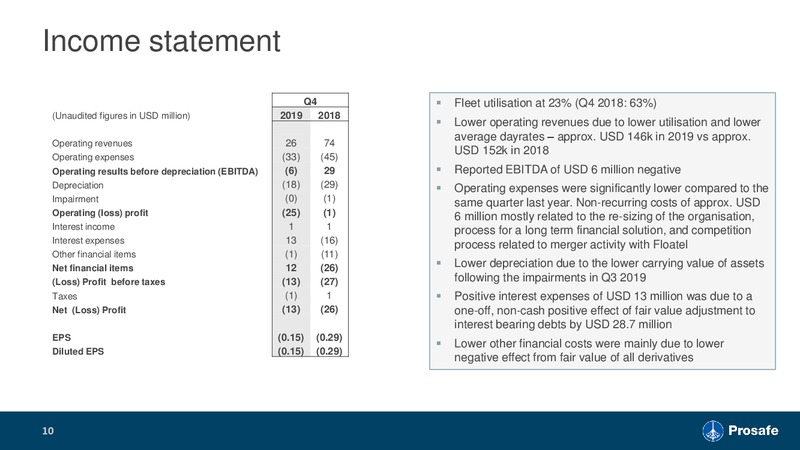
Income statement Q4 Fleet utilisation at 23% (Q4 2018: 63%) (Unaudited figures in USD million) 2019 2018 Lower operating revenues due to lower utilisation and lower average dayrates approx. USD 146k in 2019 vs approx. Operating…
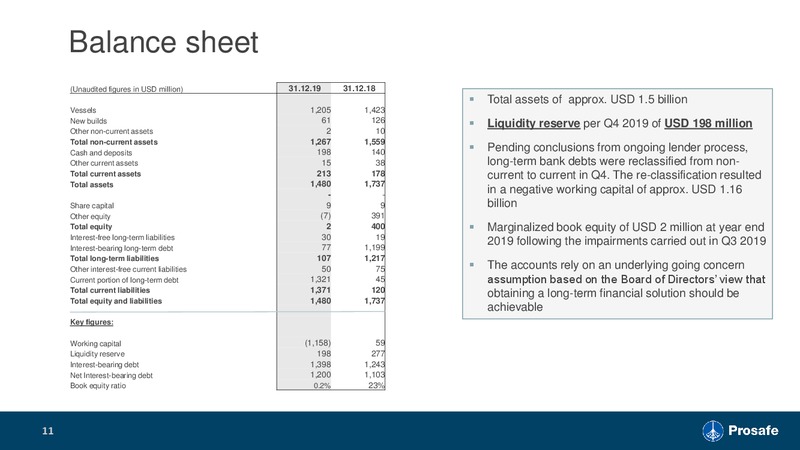
Balance sheet (Unaudited figures in USD million) 31.12.19 31.12.18 Total assets of approx. USD 1.5 billion Vessels 1,205 1,423 New builds 61 126 Liquidity reserve per Q4 2019 of USD 198 million Other non-current assets 2 10 Total…
Agenda Highlights Update on merger Update on financial situation Financial results Strategy & Summary 12
Focus areas in brief Commercial wins: Keep vessels working Best in class OPEX in operations and in lay-up Efficiency through core teams and HSSEQ excellence Internationalization: Strengthen position in Brazil Re-enter Mexico…
Order backlog per end Q4 2019 USD million 2500 Firm contracts 2000 Options 1500 1000 500 Prosafes firm backlog was USD 146 million as at end Q4 2019 0 Q2 14 Q3 14 Q4 14 Q1 15 Q2 15 Q3 15 Q4 15 Q1…
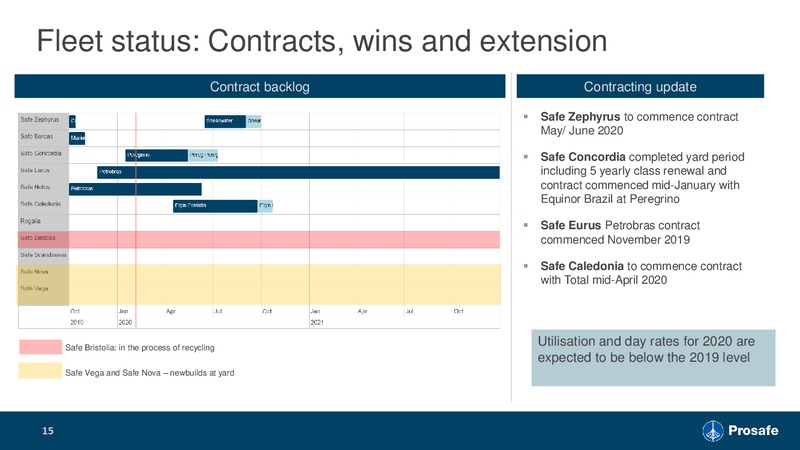
Fleet status: Contracts, wins and extension Contract backlog Contracting update Safe Zephyrus to commence contract May/ June 2020 Safe Concordia completed yard period including 5 yearly class renewal and contract commenced…
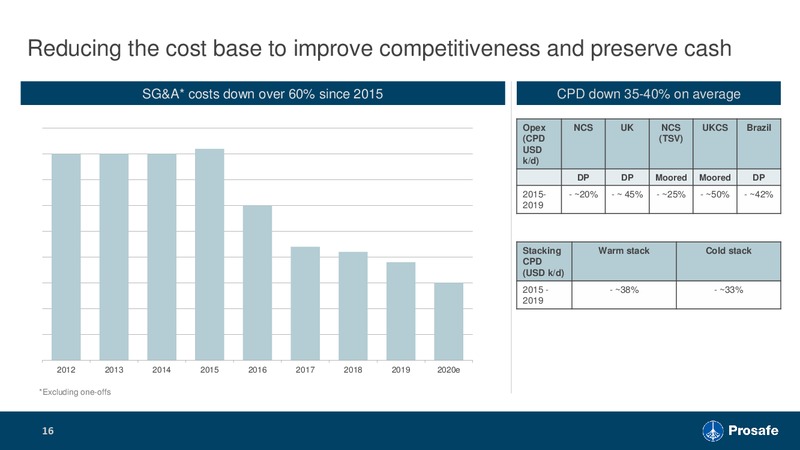
Reducing the cost base to improve competitiveness and preserve cash SG&A* costs down over 60% since 2015 CPD down 35-40% on average Opex NCS UK NCS UKCS Brazil (CPD (TSV) USD k/d) DP DP Moored Moored DP 2015- - 20% - 45% - 25% -…
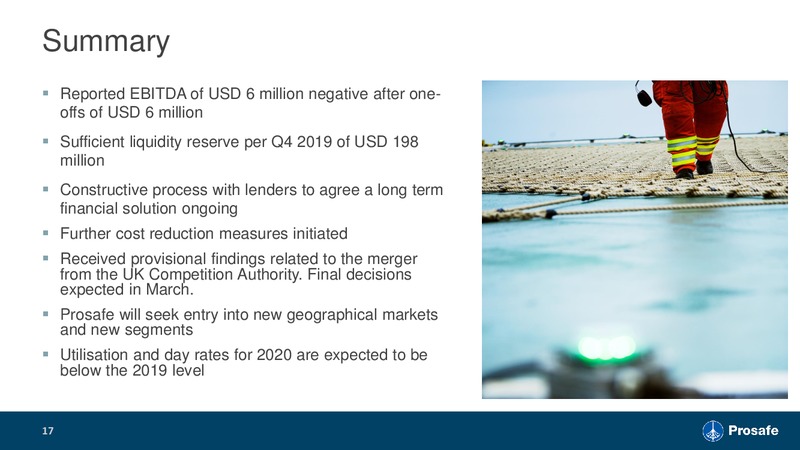
Summary Reported EBITDA of USD 6 million negative after one- offs of USD 6 million Sufficient liquidity reserve per Q4 2019 of USD 198 million Constructive process with lenders to agree a long term financial solution ongoing…
Appendix 18
Development of operating results 19
Liquidity reserve & Net interest-bearing debt 20
Operating revenue (USD million) Q4 19 Q3 19 Q4 18 2019 2018 Charter income 24.4 46.8 63.7 191.7 293.2 Other income 1.9 9.7 10.4 33.7 37.6 Total 26.3 56.5 74.1 225.4 330.8 21
Interest cost Positive interest expenses of USD 13 million was due to a one-off, non-cash positive effect of fair value adjustment to interest bearing debts by USD 28.7 million, as follows; In November 2019, Prosafe has issued letters to…
 Loading...