Fourth Quarter 2019 Earnings Presentation March 10, 2020 NYSE: CVIA
Covia: A Leading Diversified Mineral and Material Solutions Company Covia is a leading provider of advanced mineral-based material solutions across Industrial and Energy markets Industrial 19 million tons of active nameplate…
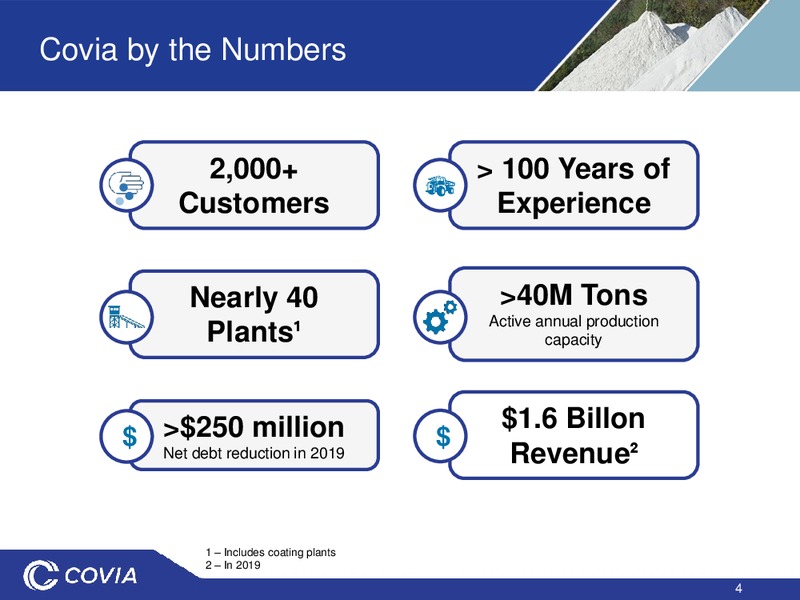
Covia by the Numbers 2,000+ 100 Years of Customers Experience Nearly 40 40M Tons Active annual production Plants capacity 1.6 Billon 250 million Net debt reduction in 2019 Revenue 1 Includes coating plants 2 In 2019…
Diverse Industrial Business COATINGS & POLYMERS FOUNDRY & METALS Paints Architectural coatings Transport - auto, rail & aerospace Agricultural films CERAMICS Equipment construction Antiblock additives agriculture & mining Tiles…
Energy Segment Matched to Market Resin Raw Sand Coated Mine Drilling Sand to Well Products Size and Scale Well Cementing Additives & Northern White Local In-Basin Curable & Tempered Last Mile Gravel Packing Sand High-quality…
Significant Progress Toward Balance Sheet Improvement Net debt reduced by over 250 million in 2019 REPOSITION GROW STRENGTHEN ENERGY SEGMENT INDUSTRIAL BALANCE SHEET Terminated 195M in railcar Commissioned Canoitas Repurchased…
Key Industrial Projects Canoitas, Mexico Expansion Project Overview 350k ton expansion of silica annual production capacity Project fueled by customers growth in Mexico Status Completed in 4Q 2019 Primary end market Glass…
Key Industrial Projects Continued Nepheline Syenite Expansion and Modernization Expected Financial Benefits Reduces annual operating costs by 9M starting in 2022 Lowers maintenance capital requirements by 30M over next 10 years…
Financial Transition Slide FINANCIALS and OUTLOOK
Quarter Highlights Fourth Quarter and Full-Year 19 Highlights Generated cash flow from operating activities of 35 million in Q4 and 104 million in 2019 Reduced net debt by 256 million in 2019 Completed Canoitas, Mexico expansion in…
Fourth Quarter 2019 Results In millions Industrial Energy Total Company Volumes (tons) 3.2 3.3 6.6 Revenue 161.4 151.9 313.3 Gross Profit 46.4 (12.5) 33.9 Contribution 46.4 1.7 48.1 Margin SG&A -- -- 37.4 Adjusted EBITDA -- --…
Full Year 2019 Results In millions Industrial Energy Total Company Volumes (tons) 14.0 16.5 30.5 Revenue 732.6 862.9 1,595.4 Gross Profit 222.2 54.1 276.3 Contribution 222.2 89.2 311.4 Margin SG&A -- -- 153.6 Adjusted EBITDA --…
Outlook Industrial 1Q 2020 Volumes 3.3 to 3.4 million tons Energy 1Q 2020 Volumes Up 10-15% sequentially Total Company 1Q 2020 Adjusted EBITDA 22M to 27M Total Company FY20 SG&A 135M to 145M Includes 10M in non-cash stock…
Appendix
Appendix: Non-GAAP Reconciliation Contribution Margin Covia Segment Information (unaudited) (in thousands) Three Months Ended December 31, Year Ended December 31, (1) In the three and twelve months ended December 31, 2019, 2019 2019…
Appendix: Non-GAAP Reconciliation EBITDA & Adjusted EBITDA Covia Net Income (Loss) Information & Reconciliation of Non-GAAP Measures (unaudited) The following table reconciles EBITDA and Adjusted EBITDA, non-GAAP financial measures, to…
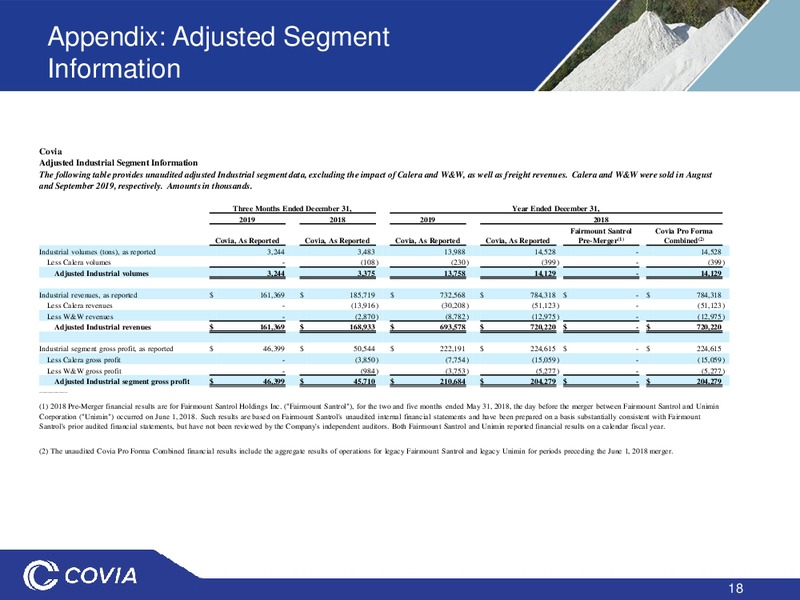
Appendix: Adjusted Segment Information Covia Adjusted Industrial Segment Information The following table provides unaudited adjusted Industrial segment data, excluding the impact of Calera and W&W, as well as freight revenues. Calera…
 Loading...