NYSE: WMB www.williams.com Investor Update Alan Armstrong, President and Chief Executive Officer John Chandler, SVP and Chief Financial Officer March 25, 2020
Purposefully built to be predictable and durable Natural gas-focused strategy driven by demand, anchored to irreplaceable infrastructure assets Natural gas supply-demand driven by market fundamentals rather than geopolitics…
Natural gas demand remains above historical norm L-48 Weekly Total Natural Gas Demand 135 125 115 Bcf/d 105 95 85 2020 3-year Average* *Average is previous 3 years 2017-2019 Sources: PointLogic Energy…
What has changed: Oil and natural gas prices NATURAL GAS curves have INCREASED CRUDE OIL curves have FALLEN 3.00 60 Natural Gas Henry Hub Crude Oil WTI Forward Curves, Then and Now Forward Curves, Then and Now 2.80 55 2.60 50…
How do key midstream factors affect Williams Williams Gas Transmission What Has Changed Williams G&P Exposure Exposure Direct Price Impacts On Gross Margin WTI crude oil price (1) Down 36% No business priced off crude oil No…
Stable and diversified EBITDA, limiting exposure to any one basin 5 B 2019 ADJ. EBITDA Other Onshore Oil Basin1 2% Only 7% EBITDA from Eagle Ford 5% Marketing & NGL Services2 2% G&P serving on-shore Blue Racer & Aux Sable 2% SW…
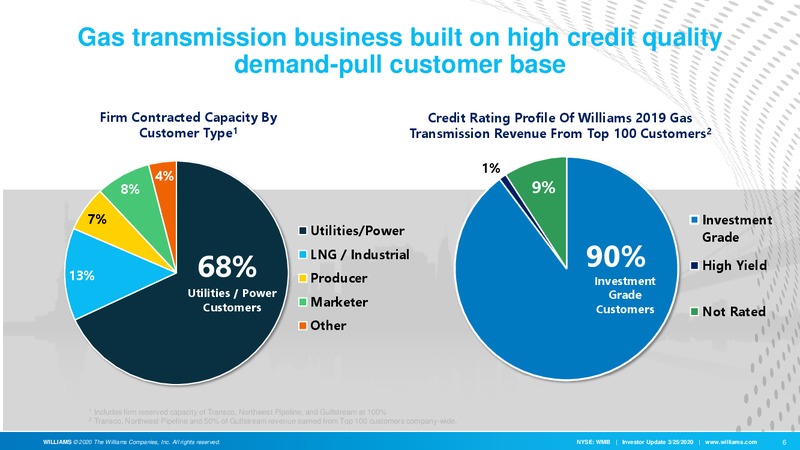
Gas transmission business built on high credit quality demand-pull customer base Firm Contracted Capacity By Credit Rating Profile Of Williams 2019 Gas Customer Type1 Transmission Revenue From Top 100 Customers2 1% 4% 8% 9% 7%…
Strong financial position provides flexibility Ample Liquidity Free Cash Flow ( Billions) 2019 Year- Expect 2020 Adjusted EBITDA to end Liquidity come in at lower end of range 4.8 Dramatically lower NGL prices Cash 0.3 impacting…
NYSE: WMB www.williams.com Forward Looking Statements Erica B. Operations Supervisor
Forward-looking statements (contd) Risks related to financing, including restrictions stemming from debt agreements, future changes in credit ratings as determined by nationally recognized credit rating agencies, and the availability…
NYSE: WMB www.williams.com Non-GAAP Reconciliations Erica B. Operations Supervisor
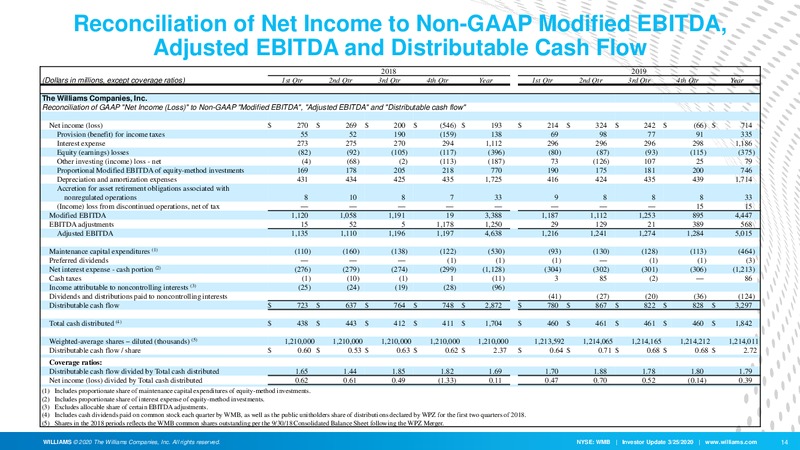
Reconciliation of Net Income to Non-GAAP Modified EBITDA, Adjusted EBITDA and Distributable Cash Flow 2018 2019 (Dollars in millions, except coverage ratios) 1st Qtr 2nd Qtr 3rd Qtr 4th Qtr Year 1st Qtr 2nd Qtr 3rd Qtr 4th Qtr Year…
Reconciliation of Net Income to Modified EBITDA, Non-GAAP Adjusted EBITDA and Distributable Cash Flow 2020 Guidance (Dollars in millions, except per share amounts and coverage ratio) Low Mid High Net income (loss) 1,200 1,350 1,500…
Reconciliation of GAAP Net Income (Loss) to Non-GAAP Adjusted Income Available to Common Stockholders 2020 Guidance (Dollars in millions, except per-share amounts) Low Mid High Net income (loss) 1,200 1,350 1,500 Less: Net income…
 Loading...