Ben van Beurden Chief Executive Officer Royal Dutch Shell April 30, 2020
Key messages Thrive in the energy Thrive in the energy transition transition Net-zero emissions energy business by 2050 or sooner Supported by Net Carbon Footprint ambition for 1.5C World-class investment case World-class…
Oil price Oil demand Uncertainty /bbl around macro economic recovery Historical Brent price Range Historical demand Range Price outlook (average) Demand outlook (average) LNG demand Refined products demand Million tonnes…
Care for each other Continuity ofbusiness Continuity of business Cash preservation Donated IPA in the Netherlands and Canada Stable and continued operations, focusing on Cash capital expenditure reduced to 20 ingredient needed for…
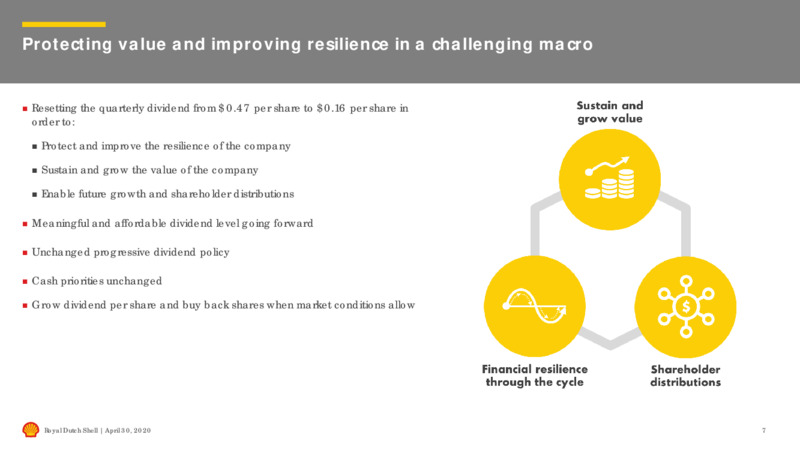
Protecting value and improving resilience in a challenging macro Resetting the quarterly dividend from 0.47 per share to 0.16 per share in order to: Protect and improve the resilience of the company Sustain and grow the value of…
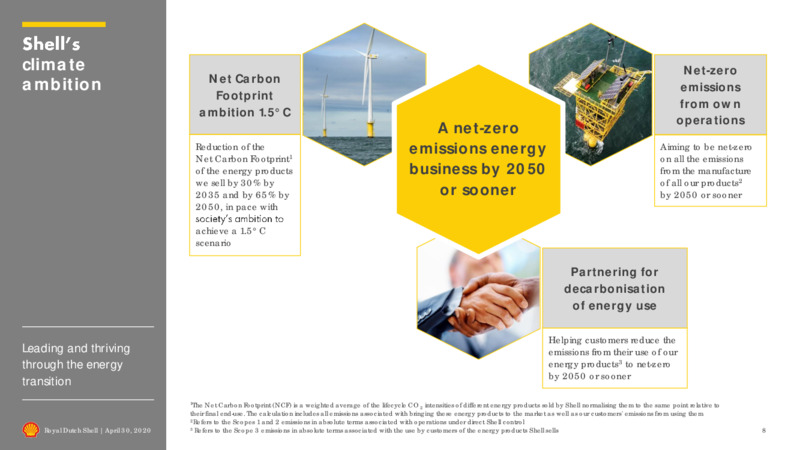
climate Net-zero Net Carbon ambition emissions Footprint from own ambition 1.5C operations A net-zero Reduction of the emissions energy Aiming to be net-zero Net Carbon Footprint1 on all the emissions of the energy products…
Jessica Uhl Chief Financial Officer Royal Dutch Shell April 30, 2020
Q1 2020 average Brent price: 50/bbl Q1 2020 Downstream margins lower than historical average Financial highlights: summary Cash Cash flow from operations excluding working capital 7.4 billion Positive working capital movements of 7.5…
CFFO ex. working capital Q1 2019 to Q1 2020 billion Q1 2019 Q1 2020 Q1 2020 billion Financial Integrated Gas 4.2 4.0 highlights: Upstream 5.3 5.6 cash flow Oil Products (0.6) 4.9 Chemicals (0.0) (0.2) Corporate (0.3) 0.6 Cash…
A resilient Significant uncertainty around commodity prices and margins framework to Unknown depth and duration of the current downcycle Managing Downside risk on volumes in Upstream, Integrated Gas and be well- uncertainties and…
Summary Thrive in the energy Thrive in the energy transition transition Net-zero emissions energy business by 2050 or sooner Supported by Net Carbon Footprint ambition for 1.5C World-class investment case World-class Resetting…
Q&A Ben van Beurden Jessica Uhl Chief Executive Officer Chief Financial Officer Royal Dutch Shell April 30, 2020
Project delivery Portfolio delivery Q1 2020 Portfolio 3 0 4 3 highlights FIDs Start-ups Growth Divestments opportunities Final investment decisions taken: Growth: Signed farm- in agreement for three offshore Australia exploration…
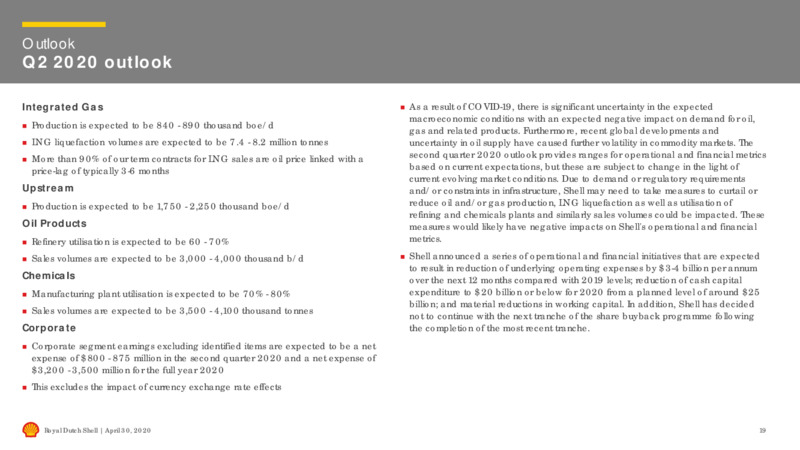
Outlook Q2 2020 outlook Integrated Gas As a result of COVID-19, there is significant uncertainty in the expected macroeconomic conditions with an expected negative impact on demand for oil, Production is expected to be 840 - 890…
Q1 2020 Prices and margins Shell oil & gas realisations Industry refining margins Industry chemicals margins per barrel per mscf per barrel per tonne Oil US West Coast US ethane Gas (RHS) US Gulf Coast coking Western Europe…
Earnings Q1 2019 to Q1 2020 Q1 2020 billion Integrated Gas results Royal Royal Dutch Dutch Shell Shell April April 30, 30, 2020 2020 21
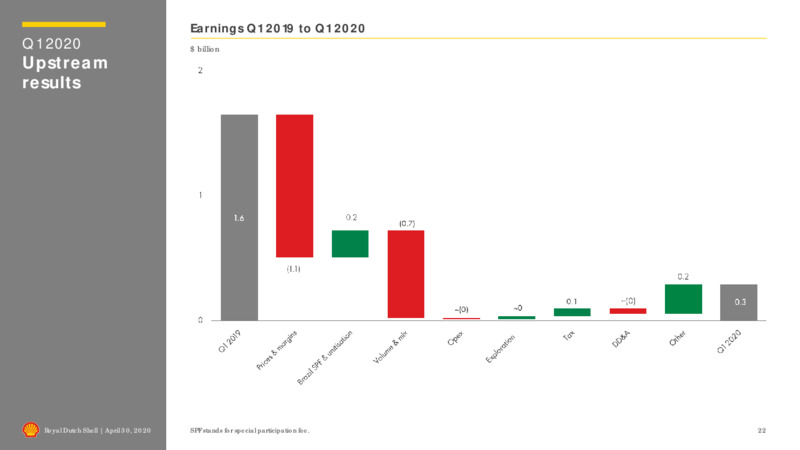
Earnings Q1 2019 to Q1 2020 Q1 2020 billion Upstream results Royal Royal Dutch Dutch Shell Shell April April 30, 30, 2020 2020 SPF stands for special participation fee. 22
Earnings Q1 2019 to Q1 2020 Q1 2020 billion Oil Products results Royal Royal Dutch Dutch Shell Shell April April 30, 30, 2020 2020 23
Earnings Q1 2019 to Q1 2020 Q1 2020 billion Chemicals results Royal Royal Dutch Dutch Shell Shell April April 30, 30, 2020 2020 24
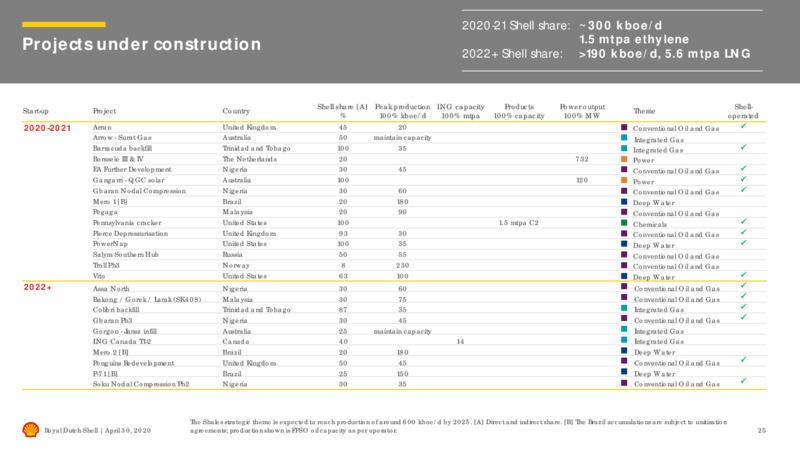
2020-21 Shell share: 300 kboe/d 1.5 mtpa ethylene Projects under construction 2022+ Shell share: 190 kboe/d, 5.6 mtpa LNG Shell share [A] Peak production LNG capacity Products Power output Shell- Start-up Project Country Theme %…
 Loading...