First Quarter 2020 accomplishments Continued to reliably deliver essential energy services across North America during this unprecedented time Business continuity plans implemented with a focus on the health and safety of our employees,…
Financial highlights Three months ended March 31 (NonGAAP) Comparable Comparable Comparable funds earnings per common share* EBITDA* generated from operations* (Dollars) (Millions) (Millions) 10% increase 6% increase 17% increase…
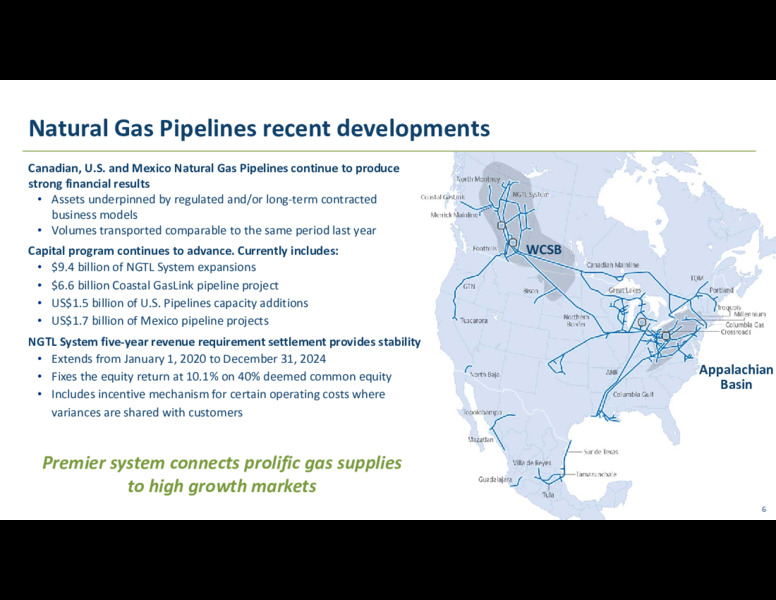
Natural Gas Pipelines recent developments Canadian, U.S. and Mexico Natural Gas Pipelines continue to produce strong financial results Assets underpinned by regulated and/or longterm contracted business models Volumes transported…
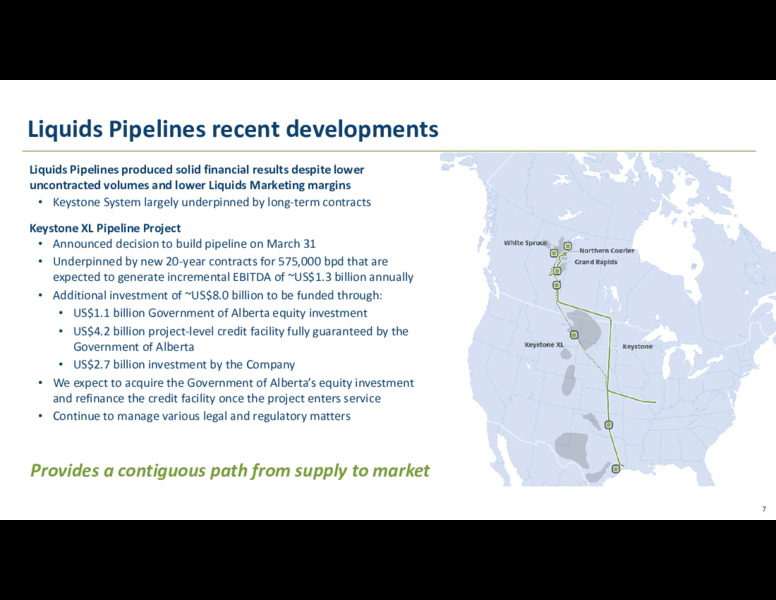
Liquids Pipelines recent developments Liquids Pipelines produced solid financial results despite lower uncontracted volumes and lower Liquids Marketing margins Keystone System largely underpinned by longterm contracts Keystone XL…
Power and Storage recent developments Power and Storage generated solid financial results Largely due to higher realized power prices and generation volumes at Bruce Power Bruce Power Life Extension Program Declared force majeure as a…
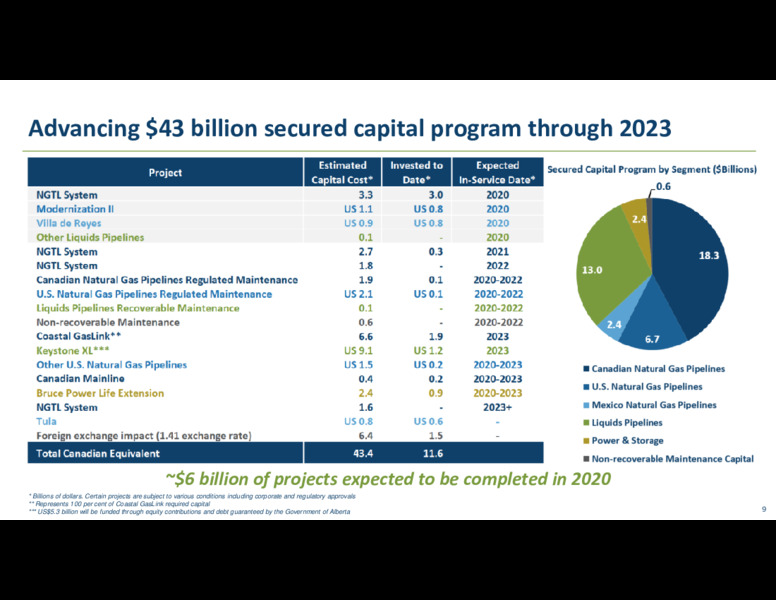
Advancing 43 billion secured capital program through 2023 6 billion of projects expected to be completed in 2020 * Billions of dollars. Certain projects are subject to various conditions including corporate and regulatory approvals…
Dividend growth outlook 57% Expected organic growth per year 810% 2021+ CAGR 3.24* 43 billion secured growth program Further incorridor expansions 7% CAGR 10+ billion development portfolio 2.08 Alberta liquids Further Bruce…
Key takeaways Proven strategy low risk business model 95% of comparable EBITDA from regulated assets and/or longterm contracts Visible growth Advancing 43 billion of secured growth projects 10+ billion of projects under development…
Don Marchand Executive VP, Strategy & Corporate Development and CFO 12
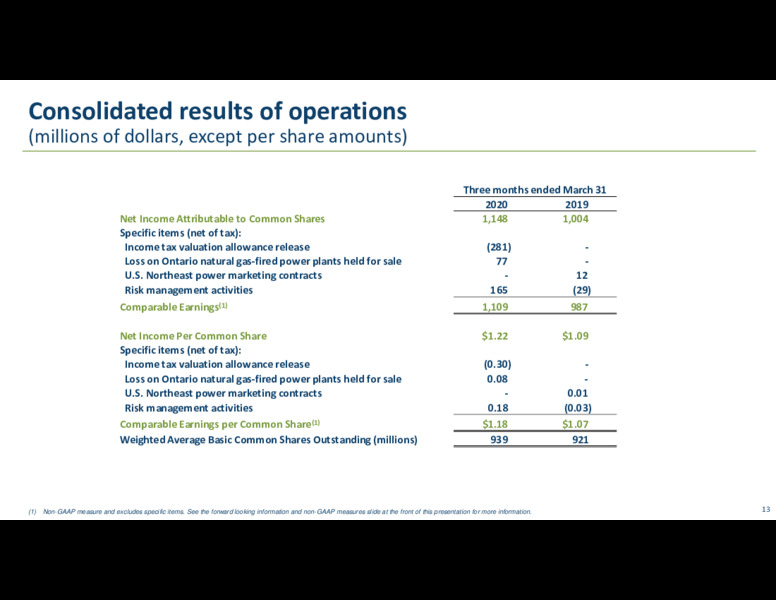
Consolidated results of operations (millions of dollars, except per share amounts) Three months ended March 31 2020 2019 Net Income Attributable to Common Shares 1,148 1,004 Specific items (net of tax): Income tax valuation…
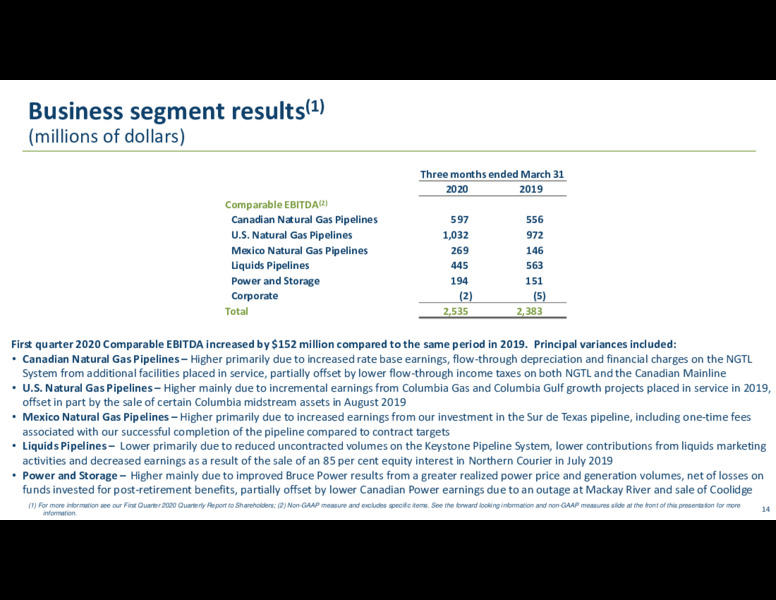
Business segment results(1) (millions of dollars) Three months ended March 31 2020 2019 Comparable EBITDA(2) Canadian Natural Gas Pipelines 597 556 U.S. Natural Gas Pipelines 1,032 972 Mexico Natural Gas Pipelines 269 146 Liquids…
Other income statement items(1) (millions of dollars) Three months ended March 31 2020 2019 Comparable EBITDA(2) 2,535 2,383 Depreciation and amortization (630) (608) Comparable EBIT(2) 1,905 1,775 Interest expense (578) (586)…
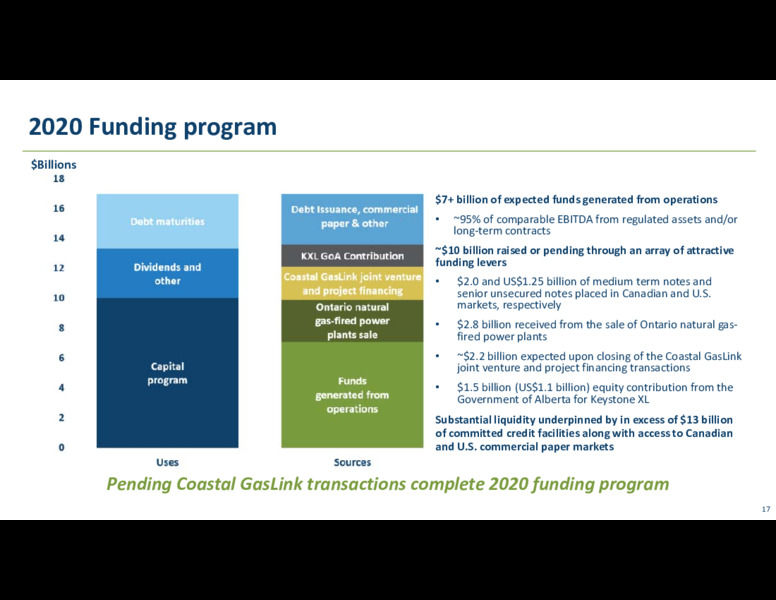
Funding program continued to advance Strong, predictable and growing cash flow from operations Comparable funds generated from operations of 2.1 billion in the first quarter, 17 per cent higher than last year Accessed capital markets on…
2020 Funding program Billions 7+ billion of expected funds generated from operations 95% of comparable EBITDA from regulated assets and/or longterm contracts 10 billion raised or pending through an array of attractive funding…
Delivering longterm shareholder value Track Visible Attractive, growing Strong record growth dividend financial position 13% average annual 43 billion secured Dividend raised 8% in Numerous levers total shareholder through 2023…
Question & answer period 19
First Quarter 2020 conference call May 1, 2020
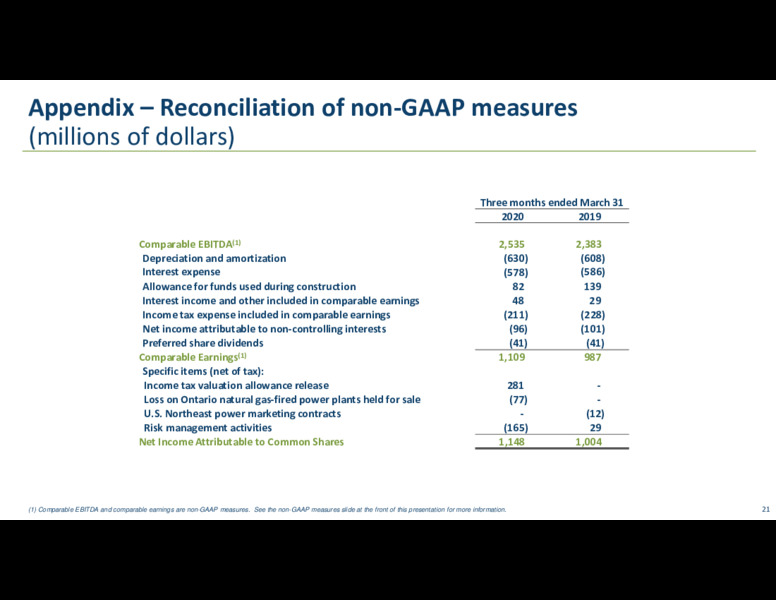
Appendix Reconciliation of nonGAAP measures (millions of dollars) Three months ended March 31 2020 2019 Comparable EBITDA(1) 2,535 2,383 Depreciation and amortization (630) (608) Interest expense (578) (586) Allowance for funds…
Appendix Reconciliation of nonGAAP measures continued (millions of dollars) Three months ended March 31 2020 2019 Net Cash Provided By Operations 1,723 1,949 Increase/(Decrease) in operating working capital 371 (142) Funds…
 Loading...