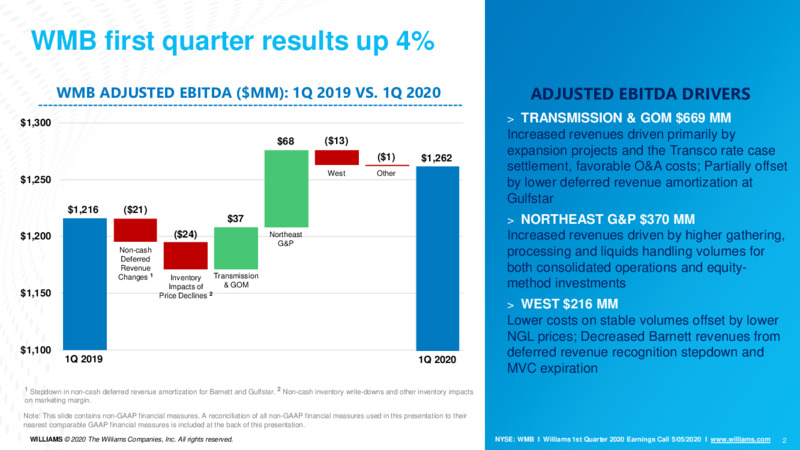
WMB first quarter results up 4% WMB ADJUSTED EBITDA (MM): 1Q 2019 VS. 1Q 2020 ADJUSTED EBITDA DRIVERS 1,300 TRANSMISSION & GOM 669 MM 68 (13) Increased revenues driven primarily by (1) expansion projects and the Transco rate case…
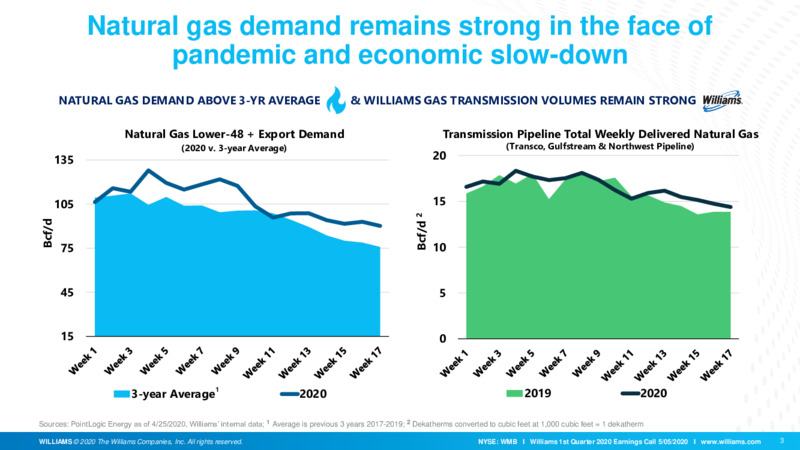
Natural gas demand remains strong in the face of pandemic and economic slow-down NATURAL GAS DEMAND ABOVE 3-YR AVERAGE & WILLIAMS GAS TRANSMISSION VOLUMES REMAIN STRONG Natural Gas Lower-48 + Export Demand Transmission Pipeline Total…
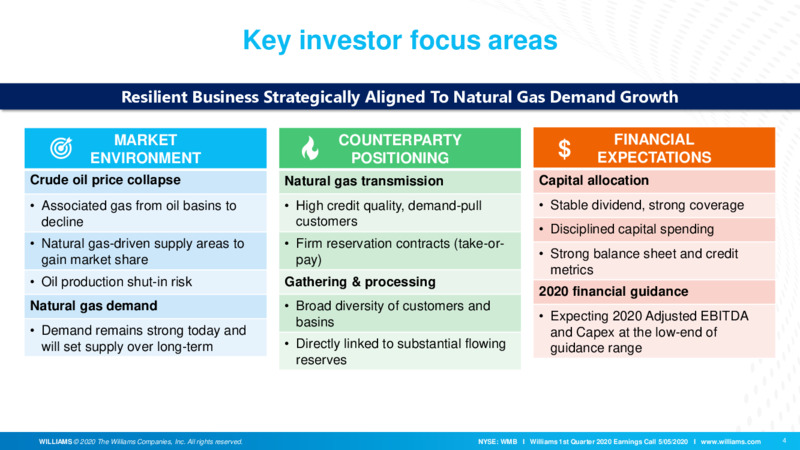
Key investor focus areas Resilient Business Strategically Aligned To Natural Gas Demand Growth MARKET COUNTERPARTY FINANCIAL ENVIRONMENT POSITIONING EXPECTATIONS Crude oil price collapse Natural gas transmission Capital allocation…
Appendix WILLIAMS 2020 The Williams Companies, Inc. All rights reserved. NYSE: WMB I Williams 1st Quarter 2020 Earnings Call 5/05/2020 I www.williams.com 5
WMB sequential quarter results stable WMB Adjusted EBITDA (MM): 4Q 2019 vs. 1Q 2020 ADJUSTED EBITDA DRIVERS 1,300 TRANSMISSION & GOM 669 MM Increased revenues due to Gateway and 1,284 (21) 47 (6) North Seattle Lateral expansion…
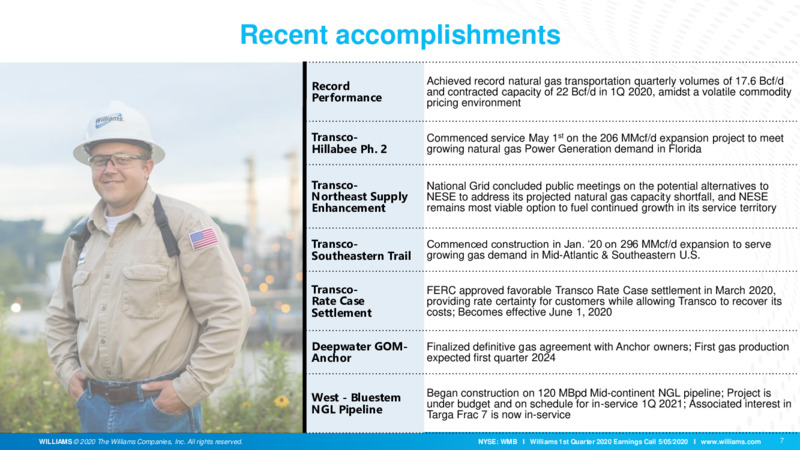
Recent accomplishments Record Achieved record natural gas transportation quarterly volumes of 17.6 Bcf/d and contracted capacity of 22 Bcf/d in 1Q 2020, amidst a volatile commodity Performance pricing environment Transco- Commenced…
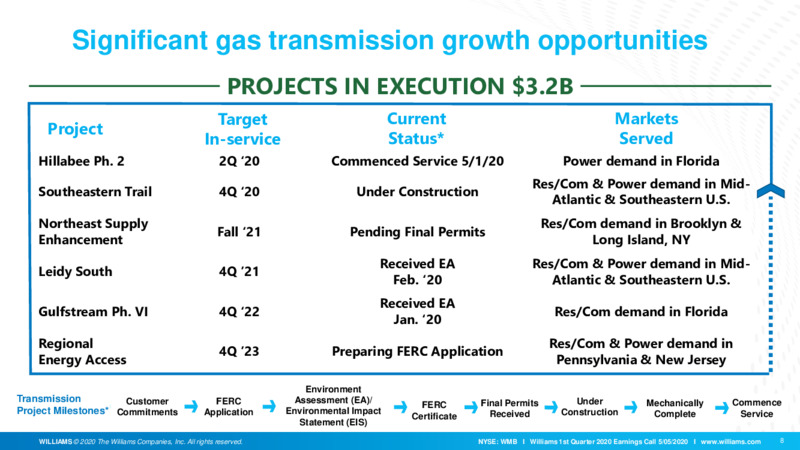
Significant gas transmission growth opportunities PROJECTS IN EXECUTION 3.2B Target Current Markets Project In-service Status* Served Hillabee Ph. 2 2Q 20 Commenced Service 5/1/20 Power demand in Florida Res/Com & Power demand in…
2020 Guidance Ranges: Expecting to be at low end of range FINANCIAL METRIC 2020 GUIDANCE Adjusted Net Income1 1.160 - 1.460 Bn Adjusted Diluted EPS1 0.95 - 1.20 Adjusted EBITDA 4.950 - 5.250 Bn Distributable Cash Flow (DCF)…
Forward Looking Statements WILLIAMS 2020 The Williams Companies, Inc. All rights reserved. NYSE: WMB I Williams 1st Quarter 2020 Earnings Call 5/05/2020 I www.williams.com 10
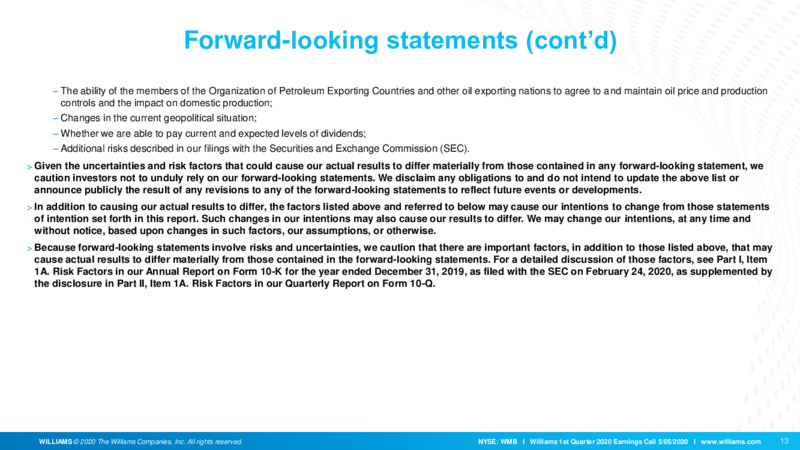
Forward-looking statements (contd) The ability of the members of the Organization of Petroleum Exporting Countries and other oil exporting nations to agree to and maintain oil price and production controls and the impact on domestic…
Non-GAAP Reconciliations WILLIAMS 2020 The Williams Companies, Inc. All rights reserved. NYSE: WMB I Williams 1st Quarter 2020 Earnings Call 5/05/2020 I www.williams.com 14
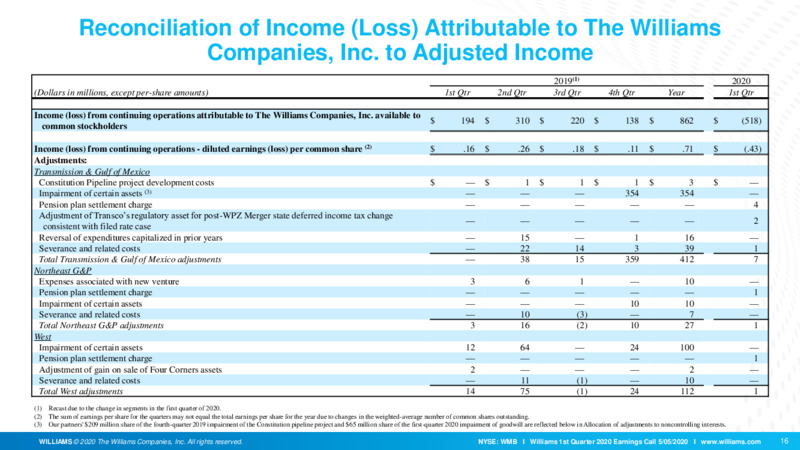
Reconciliation of Income (Loss) Attributable to The Williams Companies, Inc. to Adjusted Income 2019(1) 2020 (Dollars in millions, except per-share amounts) 1st Qtr 2nd Qtr 3rd Qtr 4th Qtr Year 1st Qtr Income (loss) from continuing…
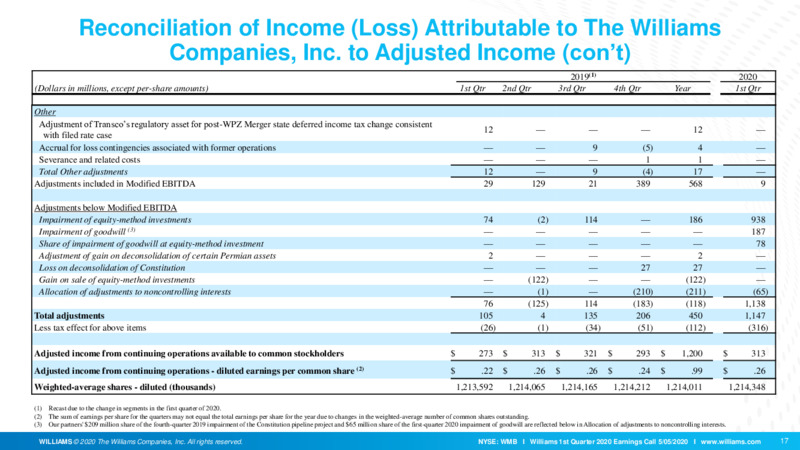
Reconciliation of Income (Loss) Attributable to The Williams Companies, Inc. to Adjusted Income (cont) 2019(1) 2020 (Dollars in millions, except per-share amounts) 1st Qtr 2nd Qtr 3rd Qtr 4th Qtr Year 1st Qtr Other Adjustment of…
Reconciliation of Net Income to Non-GAAP Modified EBITDA, Adjusted EBITDA and Distributable Cash Flow 2019 2020 (Dollars in millions, except coverage ratios) 1st Qtr 2nd Qtr 3rd Qtr 4th Qtr Year 1st Qtr The Williams Companies, Inc.…
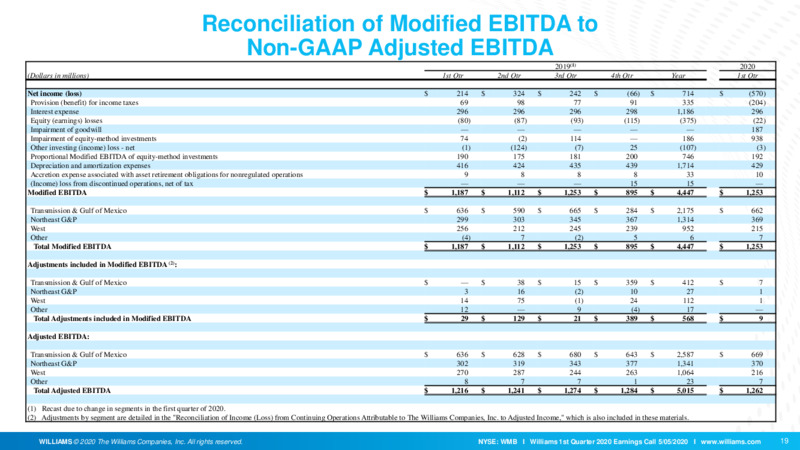
Reconciliation of Modified EBITDA to Non-GAAP Adjusted EBITDA 2019(1) 2020 (Dollars in millions) 1st Qtr 2nd Qtr 3rd Qtr 4th Qtr Year 1st Qtr Net income (loss) 214 324 242 (66) 714 (570) Provision (benefit) for income taxes 69 98 77…
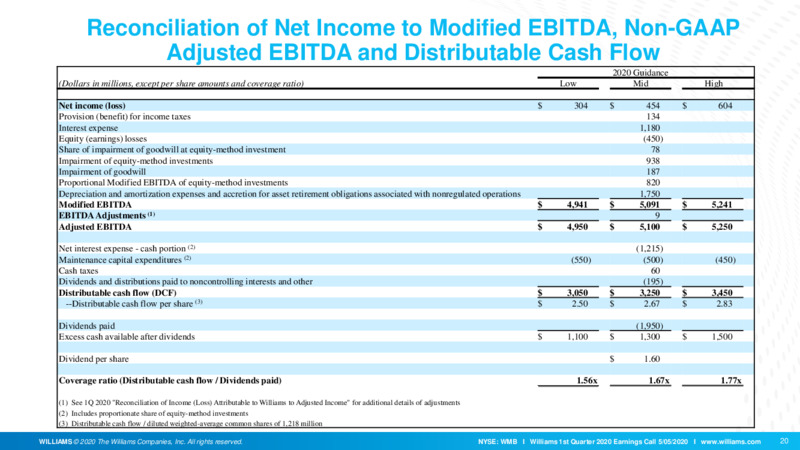
Reconciliation of Net Income to Modified EBITDA, Non-GAAP Adjusted EBITDA and Distributable Cash Flow 2020 Guidance (Dollars in millions, except per share amounts and coverage ratio) Low Mid High Net income (loss) 304 454 604…
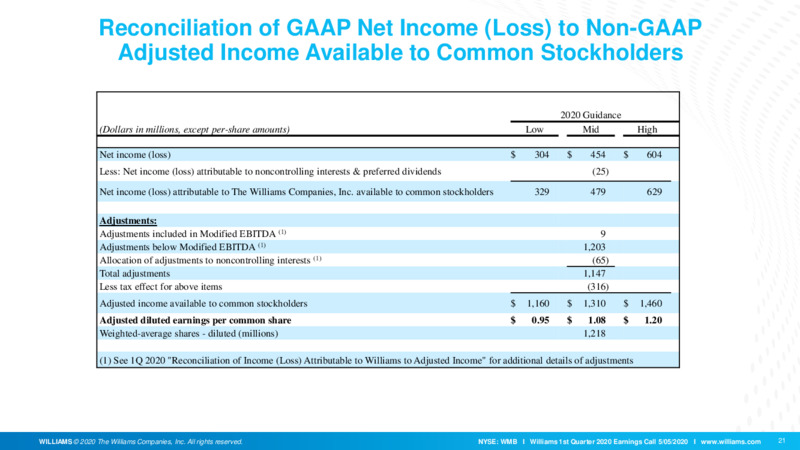
Reconciliation of GAAP Net Income (Loss) to Non-GAAP Adjusted Income Available to Common Stockholders 2020 Guidance (Dollars in millions, except per-share amounts) Low Mid High Net income (loss) 304 454 604 Less: Net income (loss)…
 Loading...