Continental Resources, Inc. Preserving Value Over Volumes 2020 Preserving CLR Value Proactive Action Taken Proactive Decision Not to Overproduce into Oversupplied Market; February Flat Capital Spend YoY March 55% Budget Reduction…
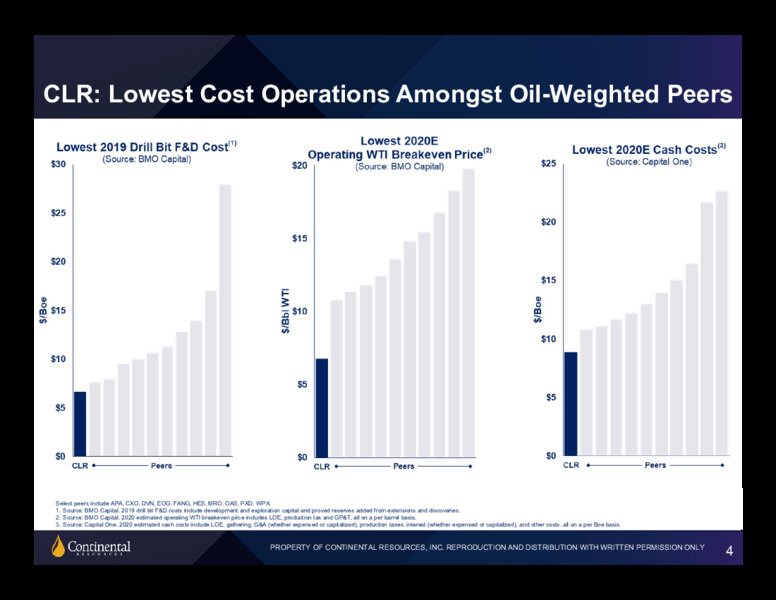
CLR: Lowest Cost Operations Amongst Oil-Weighted Peers Select peers include APA, CXO, DVN, EOG, FANG, HES, MRO, OAS, PXD, WPX. 1. Source: BMO Capital. 2019 drill bit F&D costs include development and exploration capital and proved…
CLR Bakken: Delivering Consistency & Capital Efficiency 1Q20 Results 201,502 Avg. Boepd; up 1% YoY 47 Gross Op Wells Completed Avg. Well Performance Forecast in Line with 2017-19 Programs Operating 2 Rigs through 2020…
CLR South: Flexible & Efficient Operations Deliver Results 1Q20 Results 152,010 Avg Boepd; up 22% YoY 31 Gross Op Wells Completed Currently Operating 3 Rigs Targeting 2 Rigs by Year End 2020 Flexible & Efficient South…
CLR: Preserving Value Through Flexibility & Optionality 70% Operated Oil Production Voluntarily CLRs Value Proposition Defined By Curtailed in May At Least Over 75% of (60% Boepd) 55% Capex Leasehold Reduction vs. Disciplined…
Reference Materials PROPERTY OF CONTINENTAL RESOURCES, INC. REPRODUCTION AND DISTRIBUTION WITH WRITTEN PERMISSION ONLY 9
Continuing To Deliver Strong Margins(1) 2016 2017 2018 2019 1Q 2020 Crude oil net sales price (/Bbl)(2) 35.51 45.70 59.19 51.82 39.64 Natural gas net sales price (/Mcf)(2) 1.87 2.93 3.01 1.77 0.90 Oil production (Bopd) 128,005…
Net Debt Reconciliation To GAAP Net debt is a non-GAAP measure. We define net debt as total debt less cash and cash equivalents as determined under U.S. GAAP. Net debt should not be considered an alternative to, or more meaningful than,…
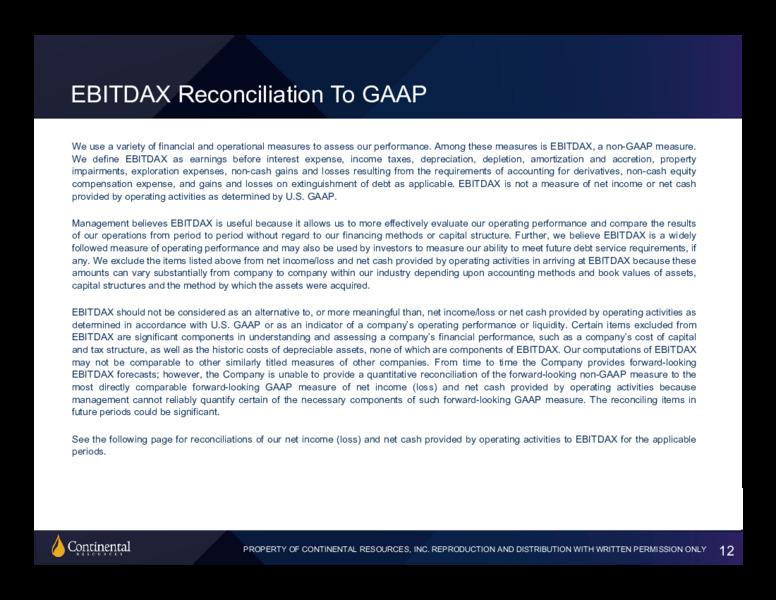
EBITDAX Reconciliation To GAAP We use a variety of financial and operational measures to assess our performance. Among these measures is EBITDAX, a non-GAAP measure. We define EBITDAX as earnings before interest expense, income taxes,…
EBITDAX Reconciliation To GAAP The following tables provide reconciliations of our net income (loss) and net cash provided by operating activities to EBITDAX for the periods presented: In thousands 2016 2017 2018 2019 1Q 2020 TTM Net…
ADJUSTED Earnings Reconciliation To GAAP Our presentation of adjusted earnings and adjusted earnings per share that exclude the effect of certain items are non-GAAP financial measures. Adjusted earnings and adjusted earnings per share…
Net Sales Prices Reconciliation To GAAP Revenues and transportation expenses associated with production from our operated properties are reported separately. For non-operated properties, we receive a net payment from the operator for our…
Cash G&A Reconciliation To GAAP Our presentation of cash general and administrative (G&A) expenses per Boe is a non-GAAP measure. We define cash G&A per Boe as total G&A determined in accordance with U.S. GAAP less non-cash equity…
 Loading...