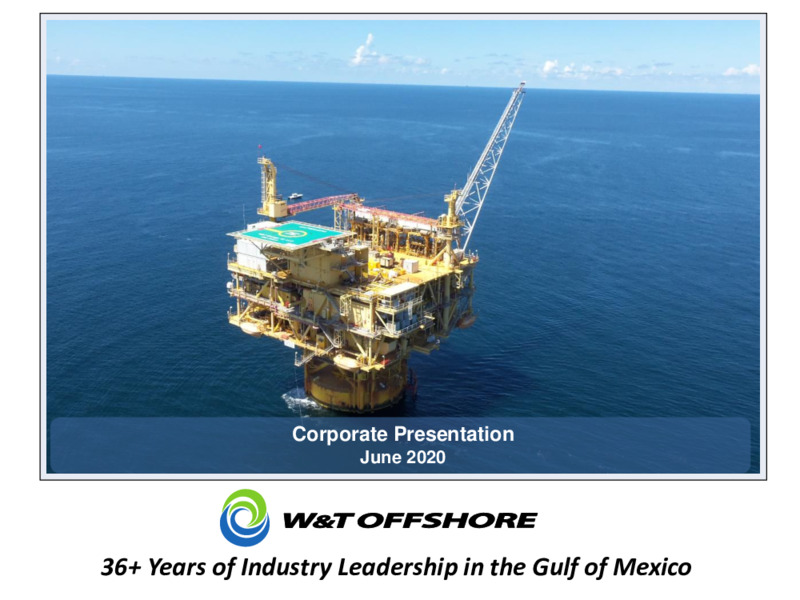
Corporate Presentation June 2020 36+ Years of Industry Leadership in the Gulf of Mexico
Company Snapshot 1Q20 Average Production: 53.6 MBoe/d (48% liquids) 1Q20 Adjusted EBITDA2 62.1 MM Fairway & Mobile Bay 2 Main Pass 108 2019 Adjusted EBITDA 282.9 MM Viosca Knoll 783 Mississippi Canyon 243 (Matterhorn) (Tahoe/SE…
Recent Highlights Produced 53,553 Boe/d, or 4.9 million Boe (48% liquids), in Q1 2020, near the high end of W&Ts guidance range, reflecting a 61% increase from Q1 2019 and slightly higher than Q4 2019 Reported Q1 2020 net income of…
Magnolia Deepwater Acquisition Key Highlights Acquired 100% working interest in and operatorship of the Magnolia Field in the central GOM, offshore Louisiana, in Garden Banks blocks 783 and 784 through two transactions Combined…
Mobile Bay Acquisition Key Highlights Acquired ExxonMobils interests and operatorship in the eastern region of the Gulf of Mexico, offshore Alabama as well as related Mobile Bay onshore processing facilities that are adjacent to…
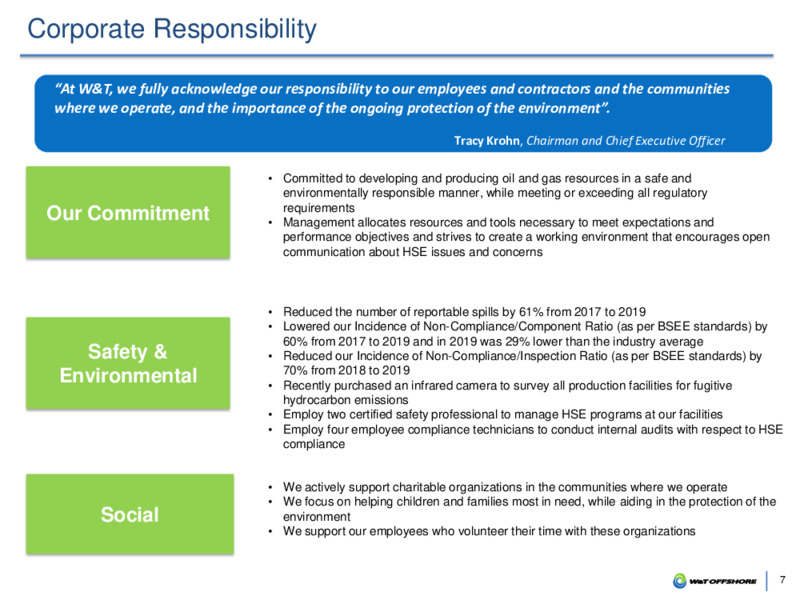
Corporate Responsibility At W&T, we fully acknowledge our responsibility to our employees and contractors and the communities where we operate, and the importance of the ongoing protection of the environment. Tracy Krohn, Chairman…
Operational Overview 8
W&Ts Response to COVID19 At our corporate offices, we instituted 100% remote work on March 23, 2020, and recently reopened our offices and implemented actions to protect our employees For our field operations, we instituted screening…
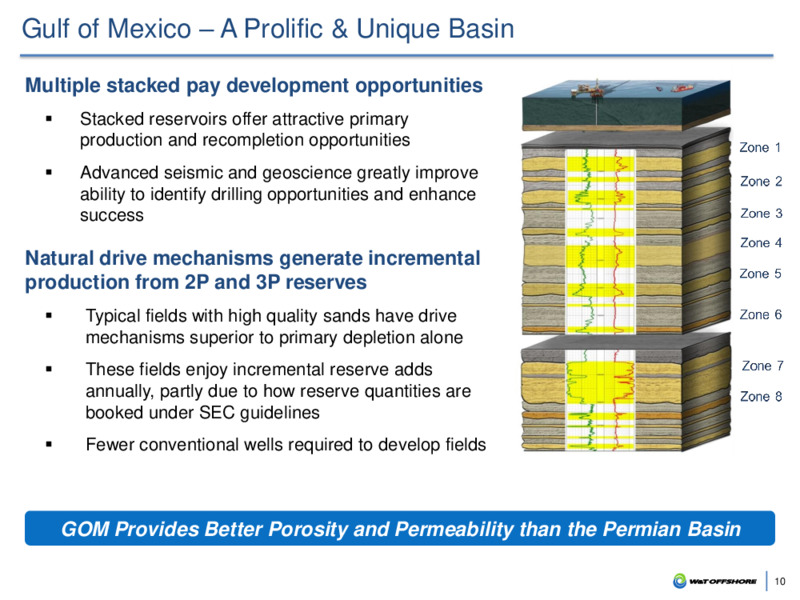
Gulf of Mexico A Prolific & Unique Basin Multiple stacked pay development opportunities Stacked reservoirs offer attractive primary production and recompletion opportunities Advanced seismic and geoscience greatly improve ability to…
Gulf of Mexico 2nd Largest U.S. Producing Basin Gulf of Mexico Historical Oil 2019 US Oil Production by Key Region 1 Production (MMBod)1 2500 GOM production at all-time high 1.9 2000 4.3 1.4 Total: 1500 12.2 MMBod…
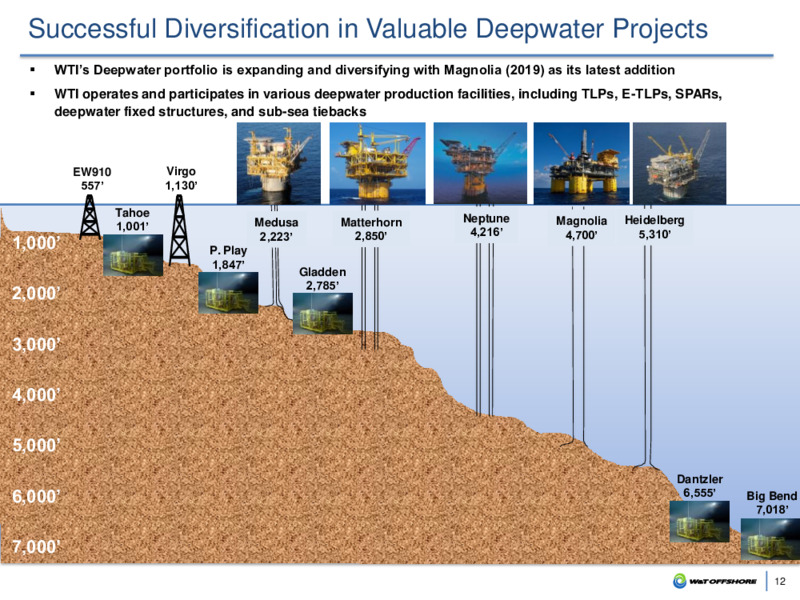
Successful Diversification in Valuable Deepwater Projects WTIs Deepwater portfolio is expanding and diversifying with Magnolia (2019) as its latest addition WTI operates and participates in various deepwater production facilities,…
Rigorous Technical Evaluation Resulting in High Drilling Success 1 2 3 4 5 Process Technical AFE Leads Screening Execute Evaluation Review 1 Leads high graded for review; once approved, project team assigned and deadlines set…
Incremental Probable and Possible Reserves May Be Produced at No Cost Strong Drive Mechanisms Allow Reserve Production From Fewer Wellbores 14
Significant W&T Reserve Appreciation From Initial Bookings Actual Results 1,2 Current 1P Initial 3P booking Current 1P Initial 3P booking Current 1P Initial 1P booking 120 100 104 + 18 80 GROSS EUR (MMBoe) 60 59 +10…
Realizing Incremental Probable and Possible Reserve Upside1 WTI focused on realizing the reserves upside and adding economic value across three categories: Prob + Poss Unrelated to 1P 1 Prob + Poss Related to PDP 2 Prob + Poss Related…
History of Creating Long-Term Value From GOM Acquisitions TOTAL NEWFIELD WOODSIDE COBALT CONOCOPHILLIPS/ 115 MM 206 MM 55 MM 17 MM MARUBENI4 Paid out in Aug. 2011 Paid out in Nov. 2014 Paid out in Sep. 2019 Paid out in Aug. 18 MM…
Significant Declines in F&D Cost 60.00 Since 2014, 3-year F&D Decreased 86% While 175 Reserve Life2 Increased 110% from 5.1 to 10.6 Years 150 50.00 125 35.40 3-Year F&D Costs (/Boe) 40.00 Avg. Day Rate (000s) 32.27…
Continued Sub-Salt Exploration and Development Success SS 349 Mahogany (WI: 100%, NRI 83.3%)1 Mahogany Platform Substantially expanded the size and depth of the field since 2011 by drilling/sidetracking 13 new producing locations…
Key Recent Field Activities as of June 20201 Developed Leases Undeveloped Exploration Leases MC 800 Gladden Deep Water depths 3,000 feet Reached TD in 2Q19, commercial success with 201 of net oil pay Completed and brought…
Attractive Current Inventory Selected Growth Prospects 1 Exploration 10 Development 5 Exploration 1 Exploration 5 Exploration 1 Development 4 Exploration 1 Development 3 Exploration 1 Development 4 Exploration 36…
GOM Drilling Joint Venture Secured 361.4 MM commitment for the development of 14 pre-identified projects in the GOM with potential to upsize program over time with additional projects Covers the total estimated cost of the 14 wells of…
Strategic Capital Allocation Plan Maintain a Prudent Balance Sheet and Use Free Cash Flow to Grow Opportunistically and Reduce Debt Organic Projects Debt Pay Down Asset Acquisitions Focus on high rate of return Use free cash…
Leveraging 36+ Years of GOM Acquisition Expertise ACQUISITION OPPORTUNITIES ACQUISITION CRITERIA GOM Exits Generating Cash Flow Companies exiting the GOM Strong current production provide a large inventory of rates with the…
Financial Overview 25
Management Ownership1 Among the Highest of Public E&P Companies2 40% 35% W&T Management Team has highest stock ownership 30% 25% 20% 15% 10% 5% 0% WTI 1) Ownership percentage of Named Executive Officers…
Significantly Improved Capital Structure Liquidity as of 06/17/20 9.75% 2nd Lien Notes due 2023 553 MM Between January 1, 2020 and June 15, 1 2020, W&T acquired 72.5 million in 2nd RBL Borrowings 80 MM Lien Notes for 23.8 million…
Generating Steady and Significant Unlevered Free Cash Flow 400 Strong production base and cost optimization 350 344 delivers steady Adjusted EBITDA1 300 283 268 Adjusted EBITDA 250 materially outpaced CAPEX and ARO MM…
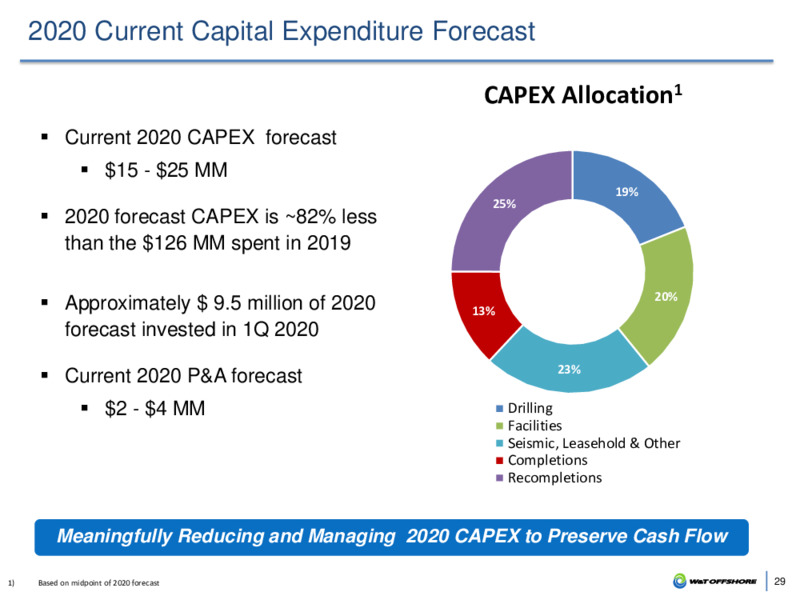
2020 Current Capital Expenditure Forecast CAPEX Allocation1 Current 2020 CAPEX forecast 15 - 25 MM 19% 25% 2020 forecast CAPEX is 82% less than the 126 MM spent in 2019 20% Approximately 9.5 million of 2020 13% forecast…
Proactive Management of Asset Retirement Obligations 1,2 Undiscounted P&A Schedule (MM) Accelerating P&A To Capture Resulting in Low ARO Low Costs Burden Over Next 3 Years WTI took advantage of low service cost Average annual ARO…
Remaining 2020 and Beyond W&T has been able to persevere and thrive through multiple pricing downturns for 40 years because of its strategy to focus on cash flow generation and continuously improve the profitability of its assets, at…
Investment Highlights Capital allocation to high return, quick payback projects allowed W&T to generate 232 MM of operating cash flow in 2019 1 Focused on Free Cash 2019 Adjusted EBITDA of 282.9 MM, 1Q 2020 was 62.1 MM Flow Generation…
Nine Greenway Plaza, Suite 300 Houston, TX 77046 33
Appendix 34
Year-End 2019 Reserves Summary1 200 180 +81 -15 157 160 140 MMBoe 120 +7 +1 100 84 80 -2 60 40 20 0 3 4 Year-End 2018 Revisions of Revisions Due Extensions, Purchases of Production Year-End 2019 Previous to SEC Base…
Reserves Summary: Year-End 2019 Reserve Report1 Current Reserve Report Overview 2 Reserve Category Total (MMBoe) % Liquids Pre-Tax PV-10% Proved Developed Producing (PDP) 122.3 36.1% 992.0 Proved Developed Non-Producing (PDNP) 11.5…
Hedging Strategy Protects Cash Flow Without Limiting Upside W&T OFFSHORE, INC. AND SUBSIDIARIES Financial Commodity Derivative Positions As of June 26, 2020 Weighted Avg Weighted Avg Weighted Avg Production Period Instrument Avg.…
Significant Infrastructure Advantage Platform Rig on infield production Subsea tieback to existing facility (EW 910 Area) infrastructure (MC 800 Gladden) 147 existing structures provide a key advantage when evaluating/developing…
Mobile Bay Acquisition XOM Producing Fields Acquired nine working interest fields 108,000 gross acres (95,600 net acres) Initial production in 1988 Water depths of 10 - 50 ft 39
Mobile Bay Acquisition Onshore Gas Treating Facilities W&T - Yellowhammer Plant ExxonMobil - Onshore Treating Facility 100% W&T ownership Established 1991 200 MMcfd capacity 100% XOM ownership 50 MMcfd gross current…
SS 349 Field (Mahogany) Case Study Mahogany Gross Production SS 349 Field (Mahogany) BOEPD 100,000 WI: 100.0%, 360 Water Depth 1st commercially successful subsalt development in the Gulf of Mexico (initial production in 1997)…
Total E&P Deepwater Acquisition Case Study BOEPD Matterhorn and Virgo Mahogany GrossGross Production Production Matterhorn & Virgo Fields 10,000 WI: 64% - 100%, 1,130 - 2,400 water depth Purchased from Total E&P, USA in 2010…
Non-GAAP Reconciliations Certain financial information included in W&Ts financial results are not measures of financial performance recognized by accounting principles generally accepted in the United States, or GAAP. These non-GAAP…
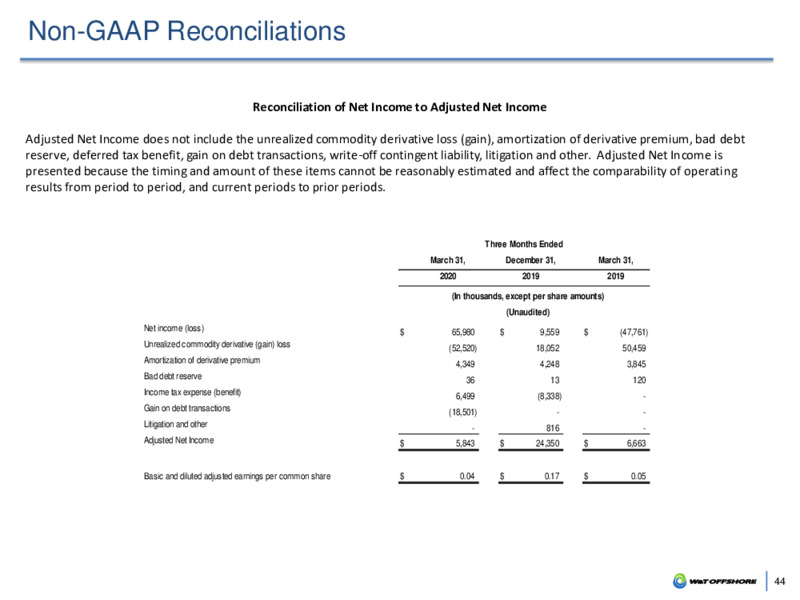
Non-GAAP Reconciliations Reconciliation of Net Income to Adjusted Net Income Adjusted Net Income does not include the unrealized commodity derivative loss (gain), amortization of derivative premium, bad debt reserve, deferred tax…
Non-GAAP Reconciliations We refer to PV-10 as the present value of estimated future net revenues of proved reserves as calculated by our independent petroleum consultant using a discount rate of 10%. This amount includes projected…
Nine Greenway Plaza, Suite 300 Houston, TX 77046 Al Petrie IR Coordinator 713-297-8024 www.wtoffshore.com apetriewtoffshore.com 46
 Loading...