PRESENTATION OUTLINE Executive Summary (pg. 4) Operational Highlights by Segment (pg. 9) Key Financial Metrics (pg. 17) 2020 Outlook (pg. 20) Non-GAAP Reconciliations (pg. 25) Questions and Answers 3
Executive Summary 4
EXECUTIVE SUMMARY ( in millions, except per share data) Three Months Ended Six Months Ended 6/30/20 6/30/19 3/31/20 6/30/20 6/30/19 Revenues 199 202 181 380 369 Gross profit 30 40 2 32 56 15% 20% 1% 8% 15% Net income (loss)1 5…
EXECUTIVE SUMMARY - HIGHLIGHTS Q2 2020 Net income1 of 5 million, 0.04 per diluted share Adjusted EBITDA2 of 48 million Operating cash flows of 23 million Free Cash Flow2 of 19 million, includes 5 million in capital spending Q2…
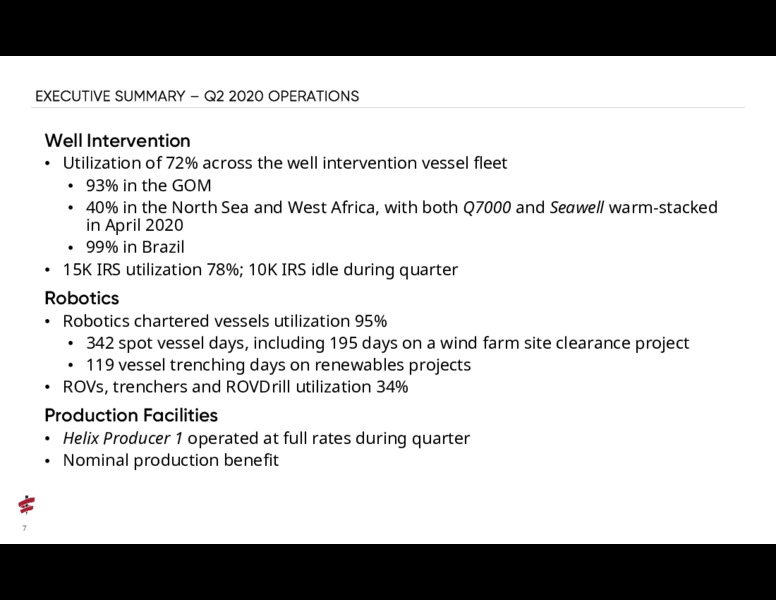
EXECUTIVE SUMMARY Q2 2020 OPERATIONS Well Intervention Utilization of 72% across the well intervention vessel fleet 93% in the GOM 40% in the North Sea and West Africa, with both Q7000 and Seawell warm-stacked in April 2020 99%…
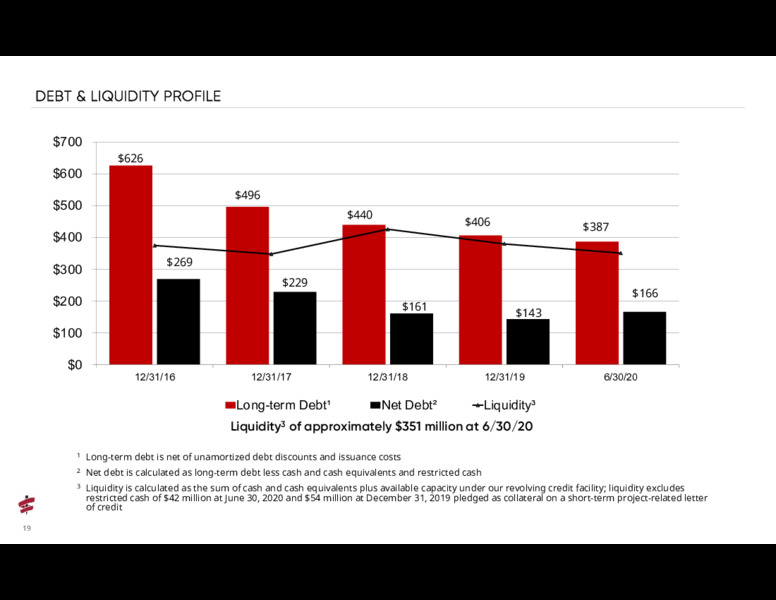
EXECUTIVE SUMMARY BALANCE SHEET Q2 2020 Cash and cash equivalents of 178 million Excludes 42 million of restricted cash1 Liquidity2 of approximately 351 million Long-term debt3 of 387 million Net debt4 of 166 million 1…
Operational Highlights by Segment 9
COVID-19 AND MARKET EVENTS The ongoing COVID-19 pandemic and its impact on the global economy have resulted in a precipitous decrease in the price of oil and caused significant disruption and uncertainty in the oil and gas market…
BUSINESS SEGMENT RESULTS ( in millions) Three Months Ended Six Months Ended 6/30/20 6/30/19 3/31/20 6/30/20 6/30/19 Revenues Well Intervention 146 159 141 286 281 Robotics 51 45 35 86 85 Production Facilities 14 16 16 29 31…
WELL INTERVENTION GULF OF MEXICO Gulf of Mexico Q5000 87% utilized in Q2; completed a one-well abandonment project for one customer; 12 days unpaid scheduled testing of 15K IRS prior to resuming operations with BP performing 15K…
WELL INTERVENTION NORTH SEA AND WEST AFRICA North Sea and West Africa Well Enhancer 87% utilized in Q2; performed enhancement work for four customers including coiled tubing operations on two wells Seawell 21% utilized in Q2;…
WELL INTERVENTION BRAZIL Brazil Siem Helix 1 99% utilized in Q2; performed workover and production enhancement operations on one well and abandonment scopes on three wells Siem Helix 2 99% utilized in Q2; performed workover…
ROBOTICS Grand Canyon II (Asia Pacific) 100% utilized in Q2 performing ROV support work Grand Canyon III (North Sea) 72% utilized in Q2 performing trenching operations for three customers and ROV support work for two customers…
UTILIZATION 100% 94% 95% 89% 92% 80% 72% 72% 60% Q2 2020 Q1 2020 40% Q2 2019 41% 34% 34% 20% 0% Well Intervention Vessels Robotics Support Vessels ROVs, Trenchers and ROVDrill Grand Canyon1,3 44 ROVs2 Q5000 Siem Helix…
Key Financial Metrics 17
DEBT INSTRUMENT PROFILE Total funded debt1 of 413 million at 6/30/20 125 million Convertible Senior Notes due 2022 4.25% Principal Payment Schedule at 6/30/20 ( in millions) 125 million Convertible Senior Notes due 2023 4.125% 150…
2020 OUTLOOK: FORECAST ( in millions) 2020 2019 Outlook Actual Revenues 655 - 740 752 Adjusted EBITDA1,2,3 115 - 145 180 Free Cash Flow1 40 - 80 31 4 Capital Additions 38 161 Revenue Split: Well Intervention 490 - 560 593…
2020 OUTLOOK Total backlog at June 30, 2020 was approximately 574 million (365 million for Well Intervention); backlog of 263 million expected to be realized during remainder of 2020 Well Intervention Outlook Q4000 (Gulf of…
2020 OUTLOOK Robotics Outlook Grand Canyon II (Asia Pacific) contracted for flotel and ROV support project through Q3; identified prospects for Q4 and expected good utilization during remainder of 2020 Grand Canyon III (North Sea)…
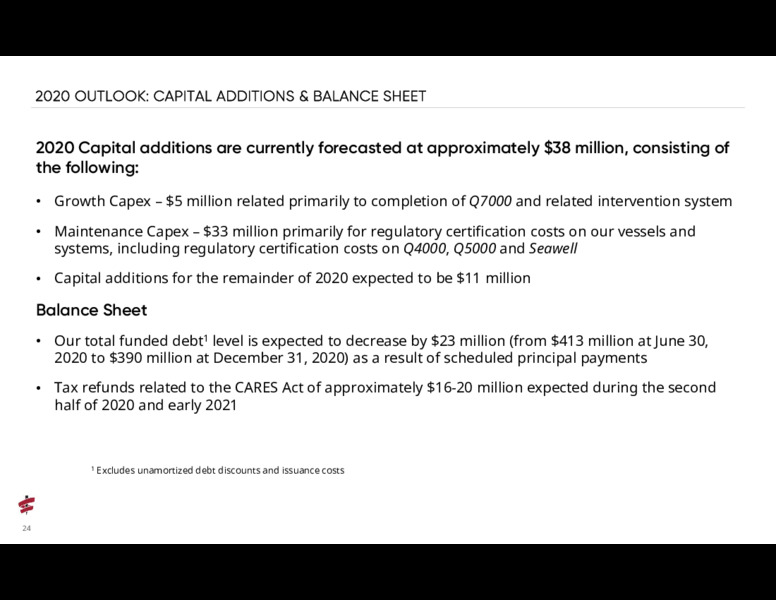
2020 OUTLOOK: CAPITAL ADDITIONS & BALANCE SHEET 2020 Capital additions are currently forecasted at approximately 38 million, consisting of the following: Growth Capex 5 million related primarily to completion of Q7000 and related…
Non-GAAP Reconciliations 25
NON-GAAP RECONCILIATIONS Twevle Months ( in thousands, unaudited) Three Months Ended Six Months Ended Ended 6/30/20 6/30/19 3/31/20 6/30/20 6/30/19 12/31/19 Adjusted EBITDA: Net income (loss) 5,450 16,823 (13,928) (8,478) 18,141…
 Loading...