Forward looking information and non-GAAP measures This presentation includes certain forward looking information, including future oriented financial information or financial outlook, which is intended to help current and potential…
Russ Girling President & CEO 3
Second Quarter 2020 accomplishments Continued to reliably deliver essential energy services across North America during this unprecedented time Despite the challenges brought about by COVID-19, our assets have been largely unimpacted…
Financial highlights Three months ended June 30 (Non-GAAP) Comparable Comparable Comparable funds earnings per common share* EBITDA* generated from operations* (Dollars) (Millions) (Millions) *Comparable earnings per common share,…
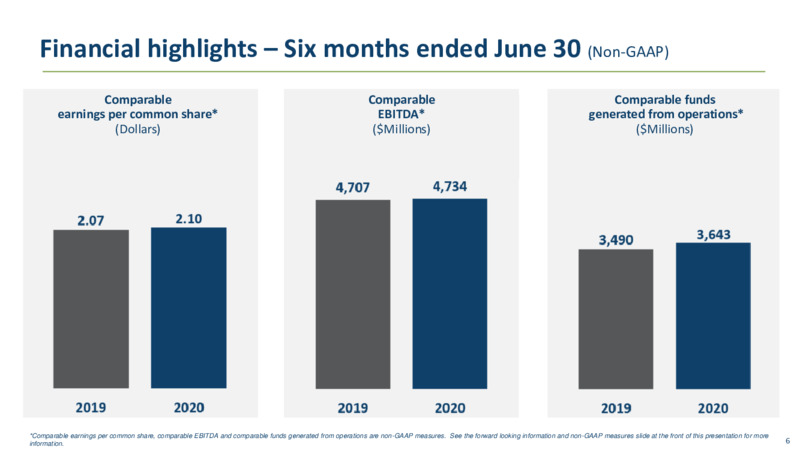
Financial highlights Six months ended June 30 (Non-GAAP) Comparable Comparable Comparable funds earnings per common share* EBITDA* generated from operations* (Dollars) (Millions) (Millions) *Comparable earnings per common share,…
Natural Gas Pipelines recent developments Canadian, U.S. and Mexico Natural Gas Pipelines continue to produce strong financial results Underpinned by regulated and/or long-term contracted assets with volume throughput across our network…
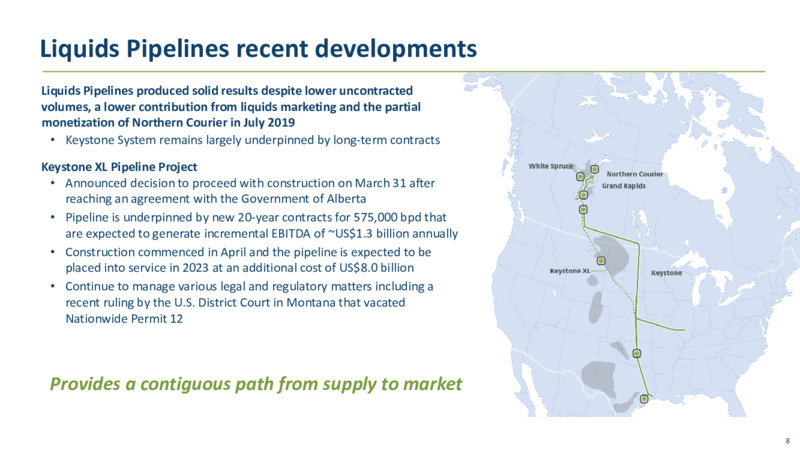
Liquids Pipelines recent developments Liquids Pipelines produced solid results despite lower uncontracted volumes, a lower contribution from liquids marketing and the partial monetization of Northern Courier in July 2019 Keystone System…
Power and Storage recent developments Bruce Power Life Extension Program Work on the Unit 6 MCR and Asset Management programs restarted on May 11 following a force majeure event in March as a result of COVID-19 Progress being made on…
Advancing 37 billion secured capital program through 2023 Estimated Invested to Expected Project Capital Cost* Date* In-Service Date* NGTL System 3.3 3.2 2020 Modernization II US 1.1 US 0.9 2020 Other Liquids Pipelines 0.1 -…
Dividend growth outlook 5-7% Expected organic growth per year 8-10% 2021+ CAGR 3.24* 37 billion secured growth program Further in-corridor expansions 7% CAGR 11 billion development portfolio 2.08 Alberta liquids Further…
Key takeaways Proven strategy low risk business model 95% of comparable EBITDA from regulated assets and/or long-term contracts Visible growth Advancing 37 billion of secured growth projects 11 billion of projects under development…
Don Marchand Executive VP, Strategy & Corporate Development and CFO 13
Consolidated results of operations (millions of dollars, except per share amounts) Three months Six months ended June 30 ended June 30 2020 2019 2020 2019 Net Income Attributable to Common Shares 1,281 1,125 2,429 2,129 Specific…
Business segment results(1) (millions of dollars) Three months Six months ended June 30 ended June 30 2020 2019 2020 2019 Comparable EBITDA(2) Canadian Natural Gas Pipelines 621 528 1,218 1,084 U.S. Natural Gas Pipelines 824 857…
Other income statement items(1) (millions of dollars) Three months Six months ended June 30 ended June 30 2020 2019 2020 2019 Comparable EBITDA(2) 2,199 2,324 4,734 4,707 Depreciation and amortization (635) (621) (1,265) (1,229)…
Funding program continued to advance Resilient and predictable cash flow generated from operations Comparable funds generated from operations of 1.5 billion in the second quarter Accessed capital markets on compelling terms in the second…
2020 Funding program Billions 7 billion of expected funds generated from operations 95% of comparable EBITDA from regulated assets and/or long-term contracts 10+ billion sourced through an array of attractive funding levers 2.0…
Delivering long-term shareholder value Track Visible Attractive, growing Strong record growth dividend financial position 13% average 37 billion secured Dividend raised 8% in Numerous levers annual total through 2023 February…
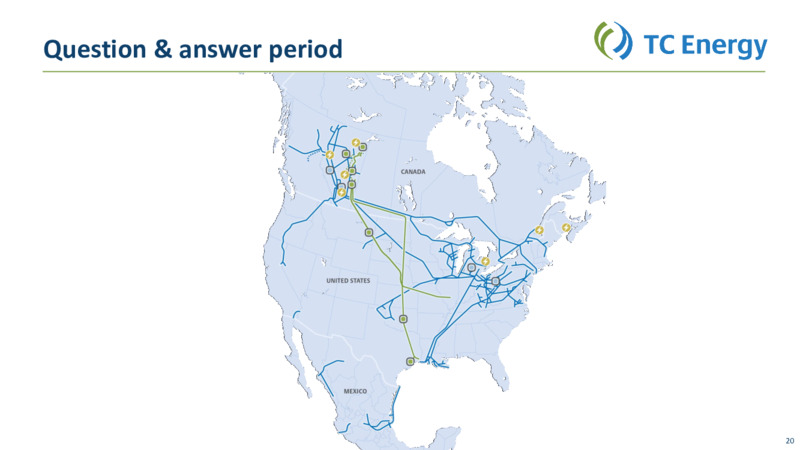
Question & answer period 20
Second Quarter 2020 conference call July 30, 2020
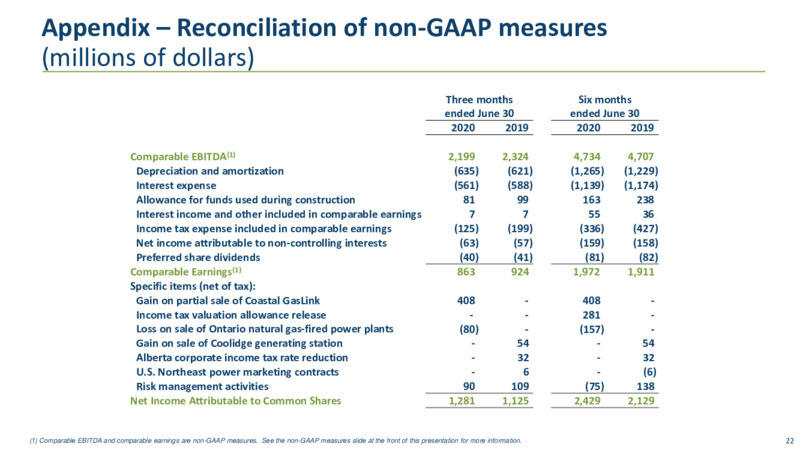
Appendix Reconciliation of non-GAAP measures (millions of dollars) Three months Six months ended June 30 ended June 30 2020 2019 2020 2019 Comparable EBITDA(1) 2,199 2,324 4,734 4,707 Depreciation and amortization (635) (621)…
Appendix Reconciliation of non-GAAP measures continued (millions of dollars) Three months Six months ended June 30 ended June 30 2020 2019 2020 2019 Net Cash Provided by Operations 1,613 1,722 3,336 3,671 (Decrease)/increase in…
 Loading...