Solid Second Quarter Results with Strong Updated 2020 Guidance 2nd Quarter Highlights 100 million of net cash from operating activities Updated 2020 Guidance Generated 60 million of free cash flow (FCF)(1) Substantially increased…
Successful Track Record of Execution Consistently Delivering Upon Transparent Messaging FINANCIAL DISCIPLINE FREE CASH FLOW GENERATION VALUE-CREATION Demonstrated commitment to reducing G&A while Successfully transitioned to new…
Positioned to Deliver Differentiating Results Track Record to Trust Strong Projections FINANCIAL DISCIPLINE FREE CASH FLOW GENERATION RISK MITIGATION Maintain commitment to further improve cost structure Successfully transitioned…
SCOTT REASONER Chief Operating Officer
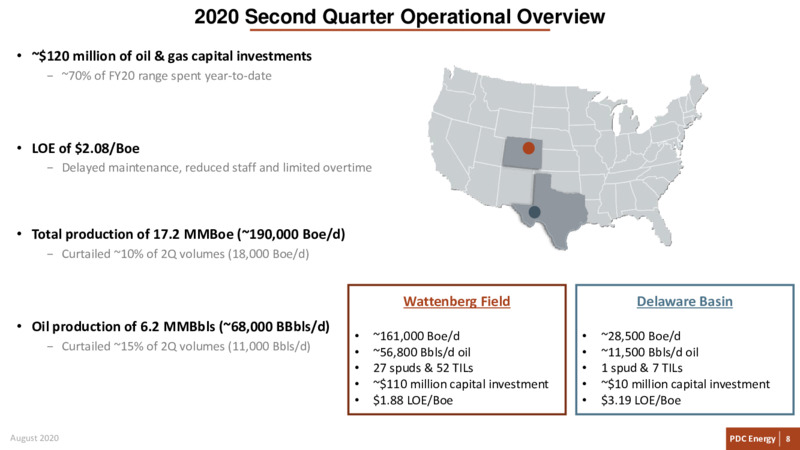
2020 Second Quarter Operational Overview 120 million of oil & gas capital investments 70% of FY20 range spent year-to-date LOE of 2.08/Boe Delayed maintenance, reduced staff and limited overtime Total production of 17.2…
Realizing Benefits of Improved Wattenberg Operating Environment DCP infrastructure expansions and reduced activity basin-wide significantly improves operating conditions and lowers average line pressures Average line pressures of 310…
Approved Permits and DUCs Offer Tremendous Flexibility 2020 election will not include any anti-Oil & Gas ballot Continue to seek and attain permits with new initiatives administration Governor Polis to actively oppose oil & gas…
SCOTT MEYERS Chief Financial Officer
2020 Second Quarter Financial Results See Appendix for Non-U.S. GAAP Reconciliations G&A per Boe Three Months Ended Six Months Ended 4.00 Run-Rate Non-Recurring Measure June 30, June 30, (millions except per share and price per…
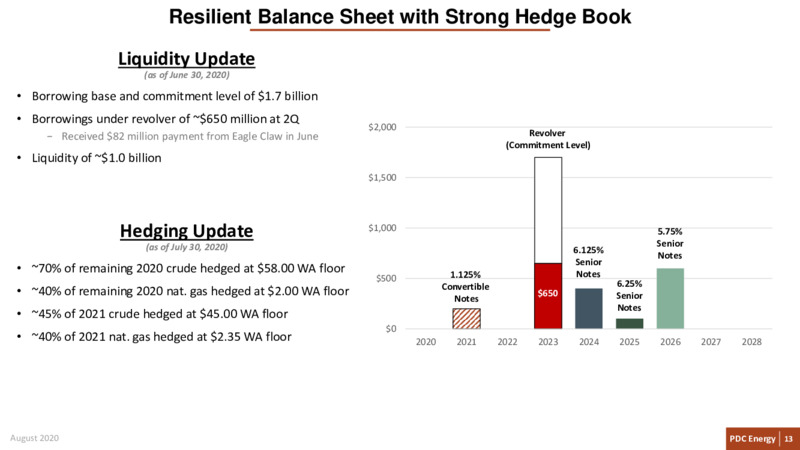
Resilient Balance Sheet with Strong Hedge Book Liquidity Update (as of June 30, 2020) Borrowing base and commitment level of 1.7 billion Borrowings under revolver of 650 million at 2Q 2,000 Received 82 million payment from Eagle…
Thriving in Low-Price World to Deliver Differentiating Results in 2020 Project Significant Free Cash Flow at 35/Bbl Oil Reduced capital investment range to 500 - 550 million 2020e Capital Investments Expect 50 million in 3Q and 100…
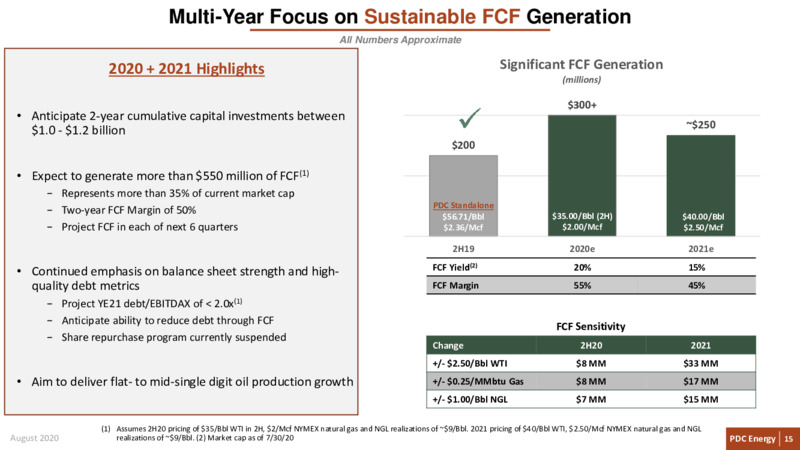
Multi-Year Focus on Sustainable FCF Generation All Numbers Approximate 2020 + 2021 Highlights Significant FCF Generation (millions) 300+ Anticipate 2-year cumulative capital investments between 1.0 - 1.2 billion 250 200…
LANCE LAUCK EVP Corporate Development & Strategy
Project to Generate Top-Tier Free Cash Flow Metrics Source: Credit Suisse Equity Research (E&P Weekly Valuation Comp Sheet 8/3/20); Share Price as of 7/31/20 2020 - 2021 Cumulative FCF Yield (Pre-Dividend) 60% Best-in-Class FCF…
PDC Leverage and Trading Multiples Relative to E&P Group Source: Credit Suisse Equity Research (E&P Weekly Valuation Comp Sheet 8/3/20); Share Price as of 7/31/20 Year-End 2021 Net Debt/EBITDAX Strong Balance Sheet 6.0x 1 of 6…
Consistent, Successful Execution of Transparent Strategy Track Record of Operational and Financial Execution Positions PDC for Sustainable Value-Creation Ability to generate consistent, sustainable free cash flow Project to generate…
Investor Relations Kyle Sourk, Senior Manager Corporate Finance & Investor Relations kyle.sourkpdce.com Corporate Headquarters Website PDC Energy, Inc. www.pdce.com 1775 Sherman Street Suite 3000 Denver, Colorado 80203…
APPENDIX
Continued Emphasis on Cost Management Targeting combined LOE + G&A of < 5/Boe Merger synergies and focus on costs reflected through anticipated LOE + G&A (/Boe) year-over-year reduction of 20+% in LOE+G&A/Boe LOE G&A 8.00 7.77…
Detailed Hedge Positions Hedges as of July 30, 2020 August 2020 PDC Energy 23
Commitment to Corporate Social Responsibility Three of PDCs Six Strategic Priorities PRIORITIZE HEALTH, SAFETY & BUILD A BEST-IN-CLASS DRIVE EFFICIENCY THROUGH THE ENVIRONMENT ORGANIZATION TECHNOLOGY & INNOVATION PDCs top…
Free Cash Flow & Adjusted Earnings Reconciliations Cash Flows from Operations to Adjusted Cash Flows from Operations and Free Cash Flow (Deficit) Three Months Ended June 30, Six Months Ended June 30, 2020 2019 2020 2019 Cash flows…
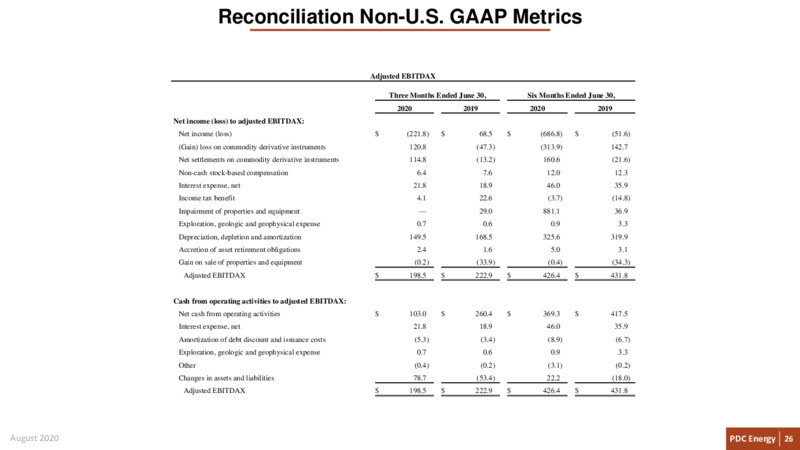
Reconciliation Non-U.S. GAAP Metrics Adjusted EBITDAX Three Months Ended June 30, Six Months Ended June 30, 2020 2019 2020 2019 Net income (loss) to adjusted EBITDAX: Net income (loss) (221.8) 68.5 (686.8) (51.6) (Gain) loss on…
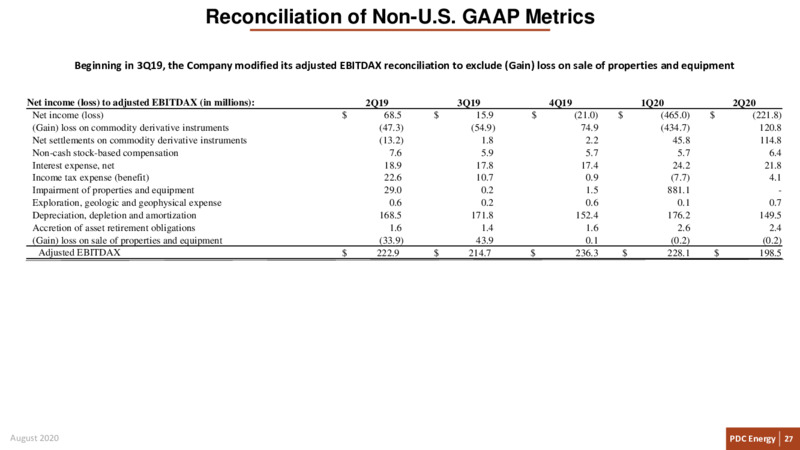
Reconciliation of Non-U.S. GAAP Metrics Beginning in 3Q19, the Company modified its adjusted EBITDAX reconciliation to exclude (Gain) loss on sale of properties and equipment Net income (loss) to adjusted EBITDAX (in millions): 2Q19…
 Loading...