financial results year ended 30 June 2020. 26 August 2020
Celebrating years results overview Rob Wheals CEO & Managing Director
FY2020 highlights sound results million FY2020 FY2019 change Statutory results Revenue excluding pass-through(1) 2,129.5 2,031.0 Up 4.8% EBITDA 1,653.9 1,573.8 Up 5.1% Net profit after tax 317.1 288.0 Up 10.1% Operating cash…
COVID-19 Impact & response Impact of COVID-19 APAs Crisis Management Team activated in March 2020: Liaise with regulators, government Pivotal part of essential service supply agencies, industry groups, customers chain and…
Orbost Gas Processing Plant Transition Agreement APA and Cooper jointly focused on Orbost Gas Processing Plant, VIC completing the plant to deliver additional gas supply to the market Aligns goals between the parties to maximise…
Strategic Imperative highlights (1/4) customer centric APA made progress in the journey to put customers at the centre through our Red Dot program and collaborating with Energy Charter signatories across the energy supply chain…
Strategic Imperative highlights (2/4) operational excellence (safety & sustainability) 99.9% gas Health and safety Sustainability nomination FY2020 TRIFR result 9.09 Developing a Sustainability delivery Roadmap, including a…
Strategic Imperative highlights (3/4) growth & innovation Growth Darling Downs Solar Farm, QLD 1.7 billion plus growth capex FY2017 FY2020 288 million growth capex in FY2020 +5.1% EBITDA growth in FY2020 Contributing assets…
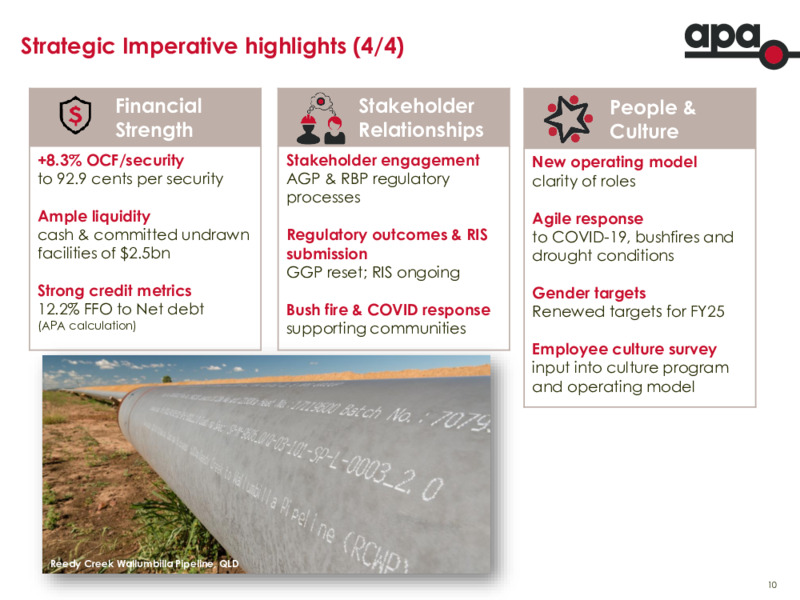
Strategic Imperative highlights (4/4) Financial Stakeholder People & Strength Relationships Culture +8.3% OCF/security Stakeholder engagement New operating model to 92.9 cents per security AGP & RBP regulatory clarity of roles…
Celebrating years financial performance Peter Fredricson Chief Financial Officer
summary results million FY2020 FY2019 Change APA made the following Revenue excluding contributions to the 2,129.5 2,031.0 4.8% pass-through(1) broader economy EBITDA 1,653.9 1,573.8 5.1% during FY2020: Depreciation and…
FY2020 result: EBITDA by business segment % of FY20 million FY2020 FY2019 Change EBITDA(1) Energy Infrastructure Queensland 1,007.9 1,010.1 (0.2%) 58.3% New South Wales 160.8 149.4 7.6% 9.3% Victoria & South Australia 104.2…
FY2020 EBITDA bridge Energy Infrastructure Am 14
low risk business model Energy Infrastructure revenue split APA has robust risk management By revenue type processes in place Capacity charge revenue: 79.1% Capacity charge revenue: 79.1% Manage counterparty risks by: Regulated…
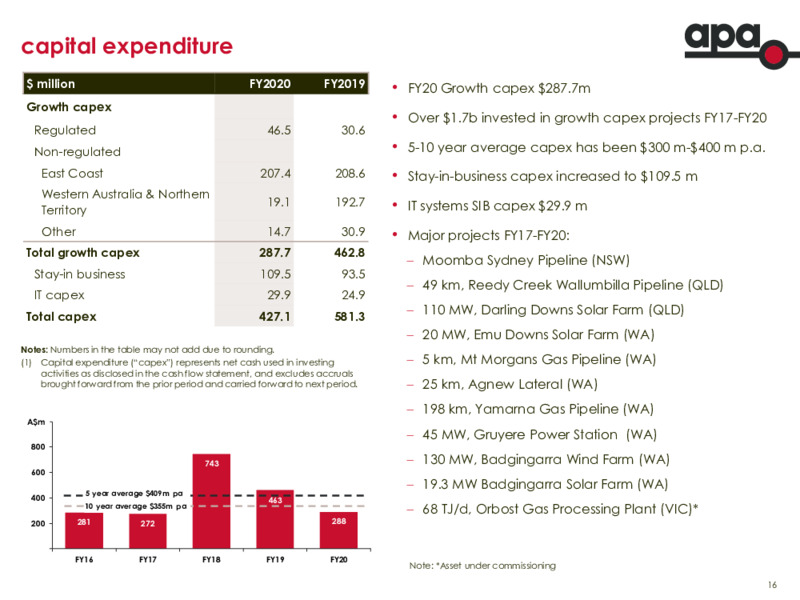
capital expenditure million FY2020 FY2019 FY20 Growth capex 287.7m Growth capex Over 1.7b invested in growth capex projects FY17-FY20 Regulated 46.5 30.6 Non-regulated 5-10 year average capex has been 300 m-400 m p.a. East Coast…
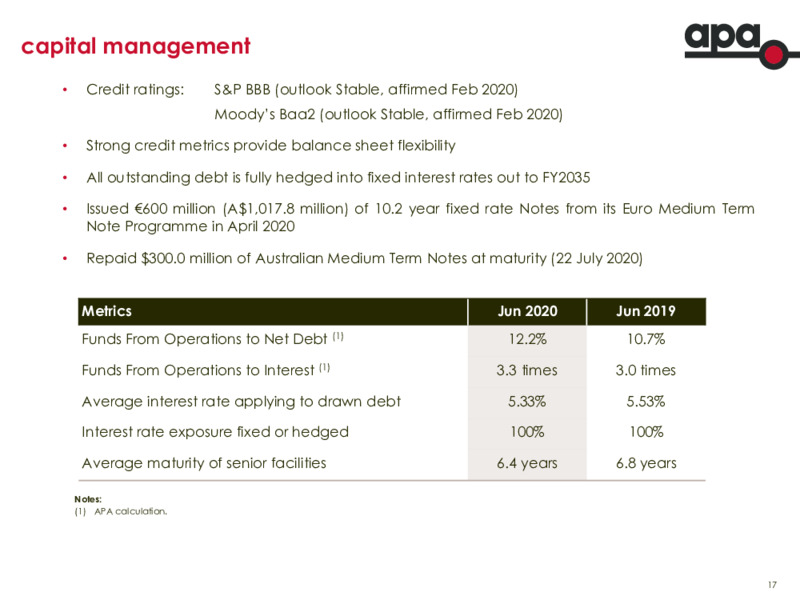
capital management Credit ratings: S&P BBB (outlook Stable, affirmed Feb 2020) Moodys Baa2 (outlook Stable, affirmed Feb 2020) Strong credit metrics provide balance sheet flexibility All outstanding debt is fully hedged into fixed…
fully covered distributions FY2020 distribution payout ratio(1) of 53.8% Franking Credits Components for FY2020 final distribution: 85.3 million tax payable for FY2020 8.53 APT profit distribution 3.66 Franking credits (FY2019: 71.8…
Celebrating years outlook & strategy Rob Wheals CEO & Managing Director
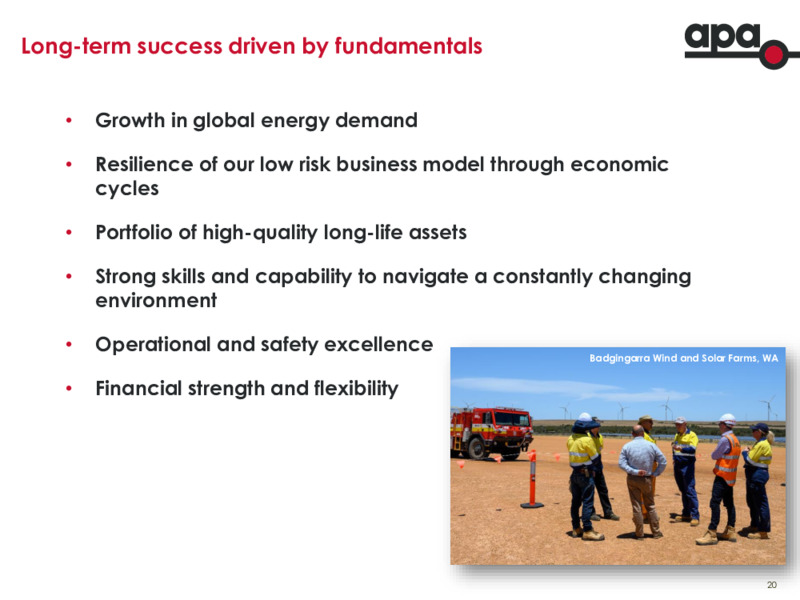
Long-term success driven by fundamentals Growth in global energy demand Resilience of our low risk business model through economic cycles Portfolio of high-quality long-life assets Strong skills and capability to navigate a…
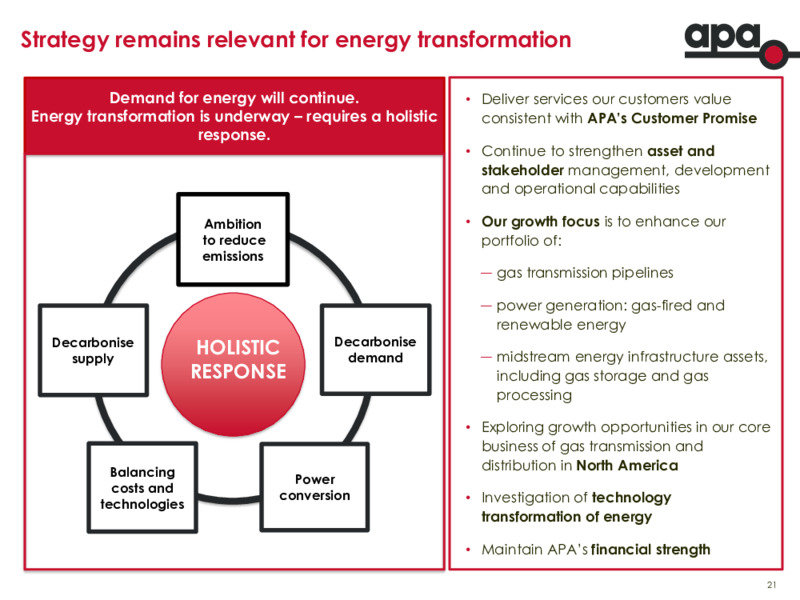
Strategy remains relevant for energy transformation Demand for energy will continue. Deliver services our customers value Energy transformation is underway requires a holistic consistent with APAs Customer Promise response. Continue…
A spectrum full of business opportunity for APA low decarbonisation Illustrative deep decarbonisation Alternative Policy approaches lowest investment highest investment Technology Transition Partial decarbonisation Net zero…
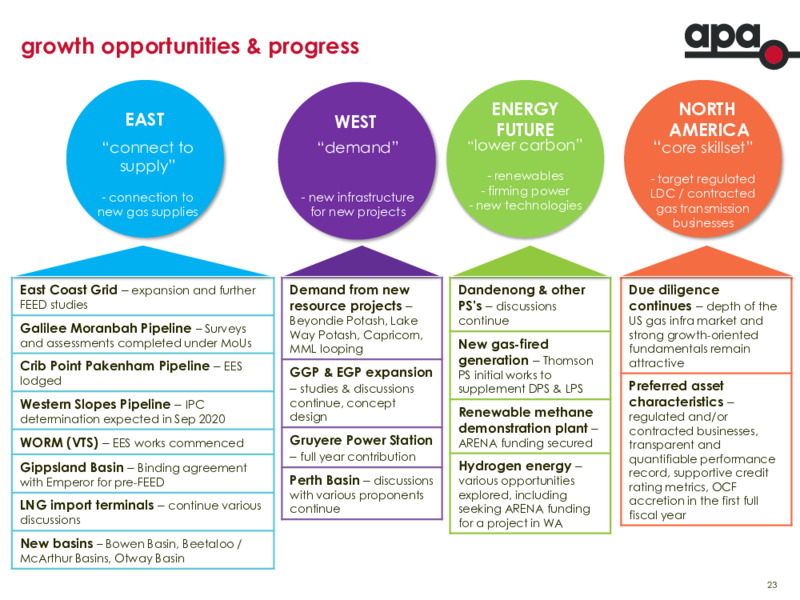
growth opportunities & progress ENERGY NORTH EAST WEST FUTURE AMERICA connect to demand lower carbon core skillset supply - renewables - target regulated - firming power LDC / contracted - connection to - new infrastructure - new…
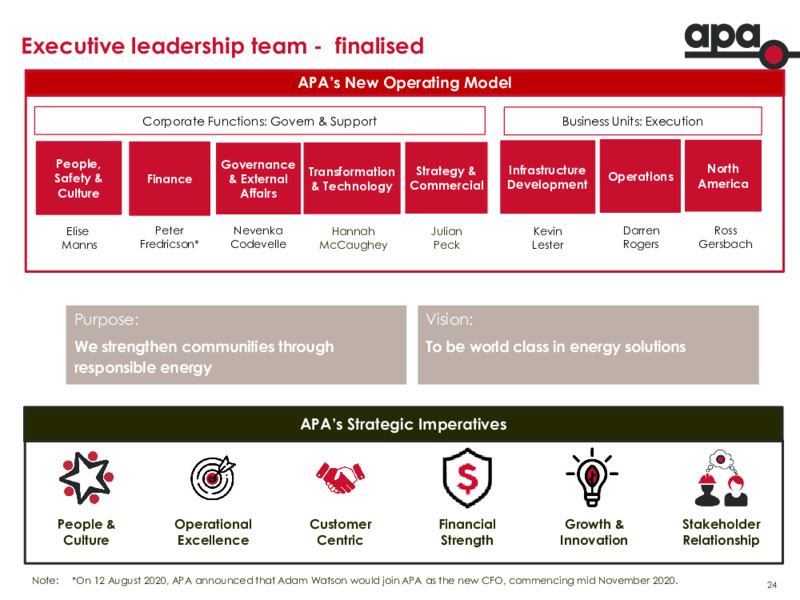
Executive leadership team - finalised APAs New Operating Model Corporate Functions: Govern & Support Business Units: Execution People, Governance North Transformation Strategy & Infrastructure Safety & Finance & External…
summary FY2020 a solid result EBITDA up 5.1% Operating cash flow up 8.3% Growth capital expenditure continued - 287.7 million Distribution of 50 cps, up 6.4%, plus 7.31 cps franking credits FY2021 Outlook FY21 EBITDA guidance 1,625…
APAs uniquely integrated energy infrastructure Assets and Investments Glossary AGPGLOS Amadeus Gas Pipeline Darwin AL Agnew Lateral WPP BGP Bonaparte Gas Pipeline 734 PJ BGP BWSF Badgingarra Wind and Solar Farms BWP Berwyndale…
For further information contact: Jennifer Blake Head of Investor Relations Tel: +61 2 9693 0097 / +61 455 071 006 E-mail: jennifer.blakeapa.com.au Or visit the APA website at: www.apa.com.au 27
 Loading...