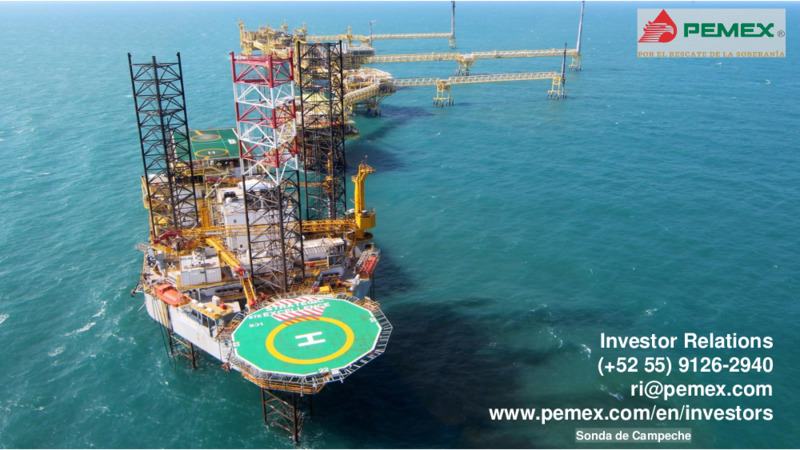
Financial and Operational Performance Comparative Analysis Sonda de Campeche
Transfers from PEMEX to SHCP and support received, Jan-Sep 2020 Budgetary figures in MXN million 489,972 Total 162,620 PEMEX has transferred Direct taxes 443,716 million to the (DUC & others) Federal Government during Jan-Sep.…
PEMEX generates resources for the Federal Government PEMEX usually does not receive budgetary resources from the Federal Government, except for some occasional cash injections that this year amount to 0.75% of the total federal…
Cash Injections from the Federal Government in 2020 Budgetary figures in MXN million 6,107,732 In 2020, PEMEXs contribution to the PEMEX received Federal Budget will be 0.7% of the Federal around 10.4% Budget in 2020…
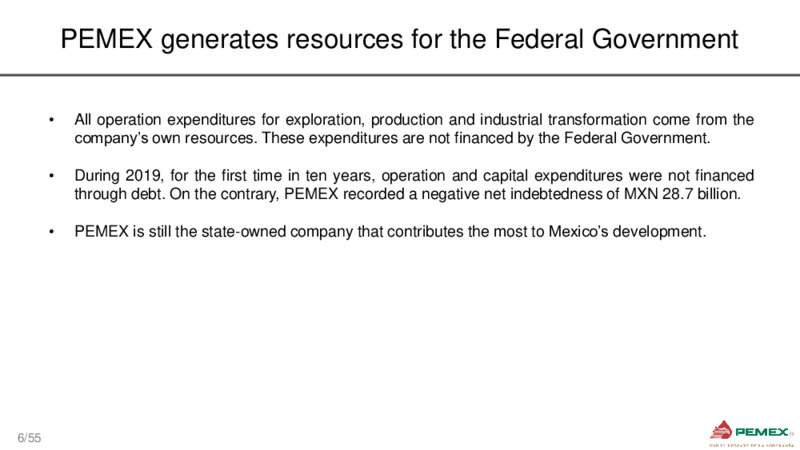
PEMEX generates resources for the Federal Government All operation expenditures for exploration, production and industrial transformation come from the companys own resources. These expenditures are not financed by the Federal…
How is PEMEX contributing to the Federal Government if its financial statements record losses With the data presented here it becomes clear that PEMEX is a competitive company that generates value for the country and in some cases,…
What are Financial Statements Financial statements provide information about the company, allowing its stakeholders to have a detailed picture about the companys financial performance. All financial transactions must be recorded as…
Financial Statements Purpose Measure the companys operational and Quantify the companys current value 1 financial performance during a specific period 2 considering assets and liabilities for the short, medium and long terms, as…
Variables used in Financial Statements Examples of variables that generate cash Examples of variables that do not flow, 2019 generate cash flow, 2019 Concept MXN million Concept MXN million Impairment (reversal) of wells, Total…
Accurate reading of PEMEX's financial statements If we want to talk about how much PEMEX is earning or losing, it is not accurate to use the comprehensive income/loss reported in the company's financial statements. A better way to…
Comprehensive income/loss, 2010-2019 (Includes items that do not generate cash flow)1 Real MXN billion (2019=100) 112 PEMEX recorded its highest comprehensive 45 losses in 2014 and 2015. Comprehensive Income/Loss includes -74…
Variables that determine PEMEXs Comprehensive Loss, 2019 MXN million 78,245 Unrealized foreign exchange profit. 60% of the total Actuarial loss due to employee benefits. comprehensive loss for 2019 -309,327 Does not generate…
Variables that determine PEMEXs Comprehensive Loss, 1H20 MXN million Impairment reversal (7,925) and unsuccessful wells 4,446 from prior years (-3,479) Do not generate cash flow 68% of the total comprehensive loss for 1H20…
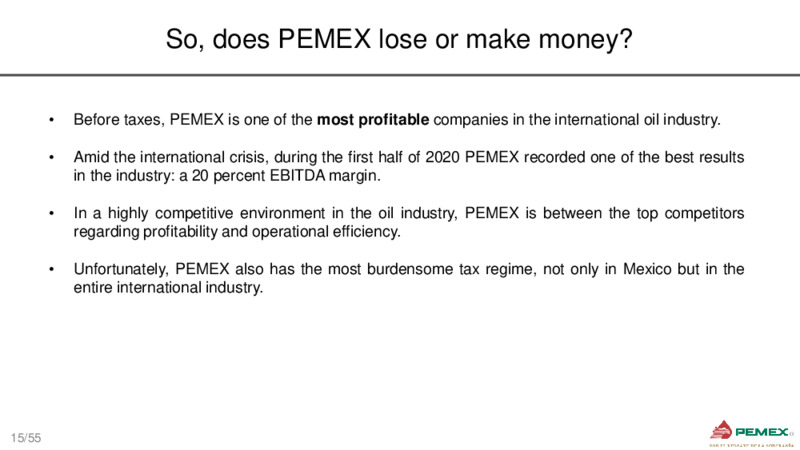
So, does PEMEX lose or make money Before taxes, PEMEX is one of the most profitable companies in the international oil industry. Amid the international crisis, during the first half of 2020 PEMEX recorded one of the best results in…
PEMEX: a company that creates value EBITDA margin, 1H20 (EBITDA / Sales percentage)1 The EBITDA margin reflects the profit or income of a 40% company before the payment of interest, taxes, amortization 34% and depreciation of fixed…
2019 & 1S20 Financial Highlights MXN billion Jan- Jun 2019 2020 1 Sales 1,402 466 2 Cost of sales 1,123 396 3 Impairment (reverse) 97 -8 4 Gross Income 182 78 Real profitability Transportation and distribution 5 145 77…
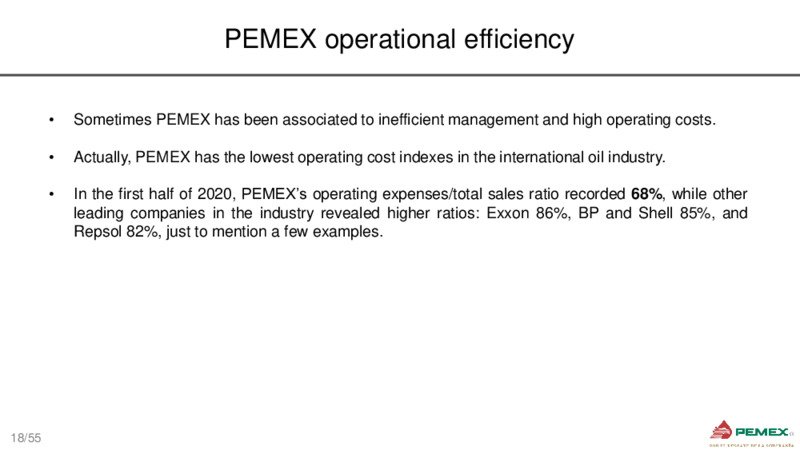
PEMEX operational efficiency Sometimes PEMEX has been associated to inefficient management and high operating costs. Actually, PEMEX has the lowest operating cost indexes in the international oil industry. In the first half of…
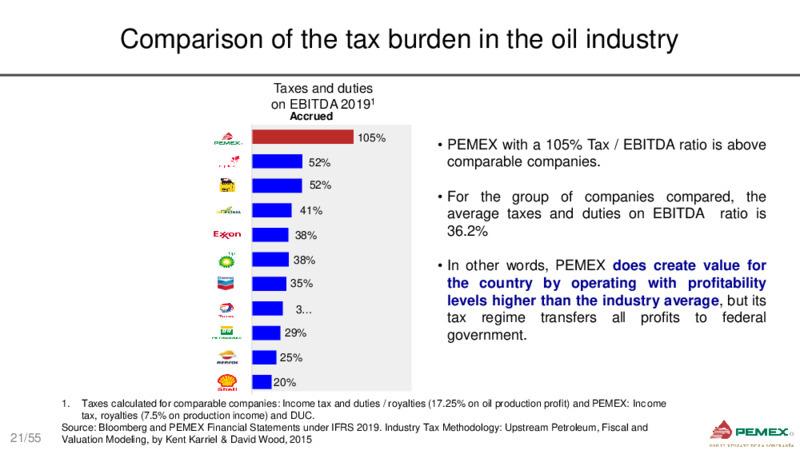
Tax burden offsets profits Unlike other companies in the industry, PEMEX has a particularity in its tax base. While the rest of the oil companies pay taxes on generated profit, PEMEX pays taxes on gross value associated to…
Comparison of the tax burden in the oil industry Taxes and duties on EBITDA 20191 Accrued 105% PEMEX with a 105% Tax / EBITDA ratio is above 52% comparable companies. 52% For the group of companies compared, the 41% average…
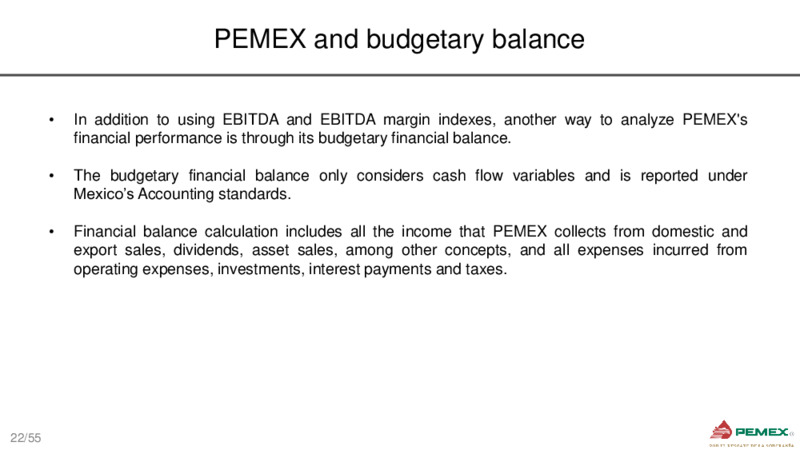
PEMEX and budgetary balance In addition to using EBITDA and EBITDA margin indexes, another way to analyze PEMEX's financial performance is through its budgetary financial balance. The budgetary financial balance only considers cash…
PEMEX: Budgetary Financial Balance, 2019 MXN billion 1,899 PEMEX does generate value, 183 with a primary balance of 1.0 9.6% trillion pesos, but tax burden was 501 85.9% as compared to this 1,220 balance. 201 1,018 For the…
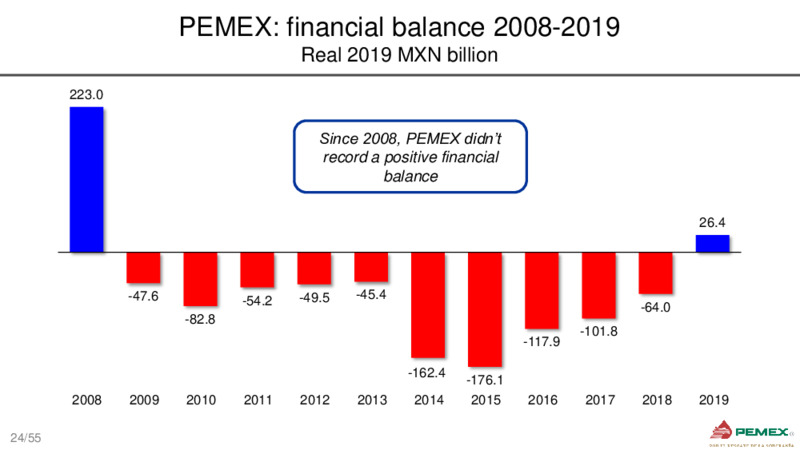
PEMEX: financial balance 2008-2019 Real 2019 MXN billion 223.0 Since 2008, PEMEX didnt record a positive financial balance 26.4 -47.6 -54.2 -49.5 -45.4 -64.0 -82.8 -101.8 -117.9 -162.4 -176.1 2008 2009 2010 2011…
Crude Oil Production, Jan-Agu 20201 Thousand barrels per day Production shut-in (OPEC+ agreement ) The decrease in production 1,749 1,755 1,771 1,747 during May-July was induced to comply with the OPEC 1,677 1,688 1,655 1,647…
Crude Oil Production 2018-20201 Thousand barrels per day Lowest Shut in production 1,932 1,897 record 1,888 2,000 (OPEP+ agreement) 1,870 1,867 1,848 1,843 1,827 1,818 1,900 1,771 1,767 1,755…
PEMEXs Crude Oil Production 2018-20201 Thousand barrels per day Lowest Shut in production 1,928 1,893 record 1,879 2,000 (OPEP+ agreement) 1,861 1,858 1,839 1,834 1,812 1,803 1,900 1,753 1,752 1,736…
Mexicos Crude Oil Production Jan-Aug 20201 Thousand barrels per day 1,731 After almost 6 years from the energy reform, Petrleos Mexicanos contributes the most to Mexicos crude oil production 1,711 98.9% PEMEX + Partners…
PEMEX Achieves Production of New Developments in Record Time Thousand barrels per day 140 PEMEX starts PEMEX in 120 PEMEX's production of new development of 1.7 years developments is 5 times higher as 20 new fields 121.7 Mbd 100…
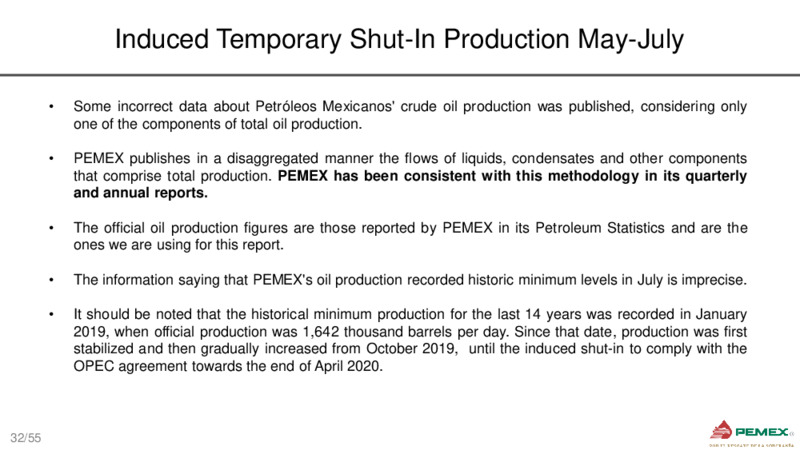
Induced Temporary Shut-In Production May-July Some incorrect data about Petrleos Mexicanos' crude oil production was published, considering only one of the components of total oil production. PEMEX publishes in a disaggregated…
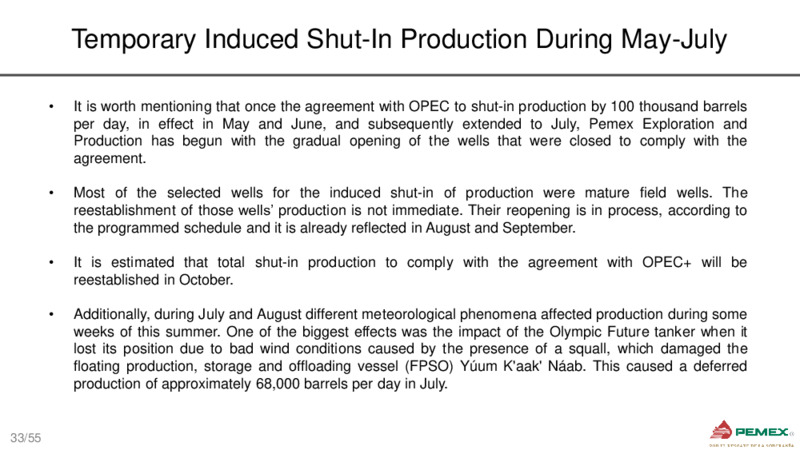
Temporary Induced Shut-In Production During May-July It is worth mentioning that once the agreement with OPEC to shut-in production by 100 thousand barrels per day, in effect in May and June, and subsequently extended to July, Pemex…
Crude Oil Production Increase from the New Fields 120 Development Well Sept (Mbd) Development Well Sept (Mbd) Cahua-2 3.6 8 Manik Manik-4 4.3 1 Cahua Of the 20 new Cahua-3 1.8 Mulach-10 7.1 developments, 15 have 100 Cheek-1 5.3 9…
PEMEXs Effort to Stabilize and Increase Crude Oil Production 2019-2020 Thousand barrels per day 1,800 Base Incremental fields en execution New fields 1,814 1,800 Base production 1,600 1,626 1,600 1,626 1,400 1,400 Results…
Dimension of the effort of Petrleos Mexicanos' workers to maintain base production Due to the maturity of most of our fields, the decline in crude oil production is around 26 percent per year, or approximately 387,000 barrels per day…
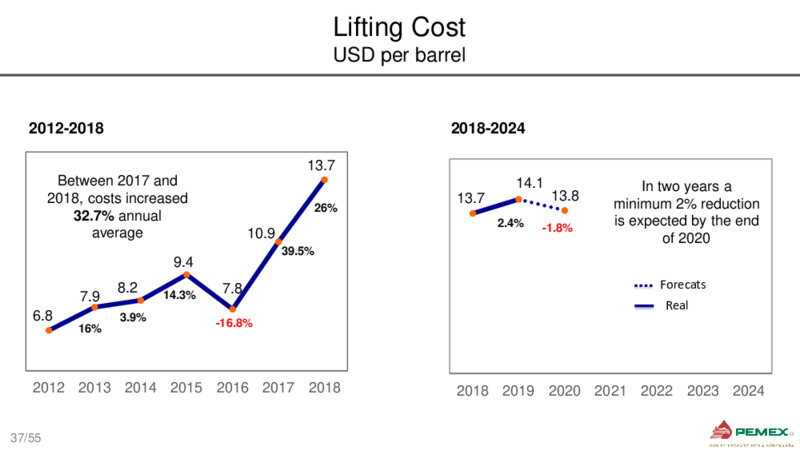
Lifting Cost USD per barrel 2012-2018 2018-2024 13.7 Between 2017 and 14.1 In two years a 2018, costs increased -1.8% -2.4% 13.7 -5.3% 13.8 -2.9% -2.1% minimum 2% reduction 26% 0.0% 32.7% annual 2.4% is expected by the end…
38/55
Budgetary Investment MXN billion 2012-2018 2018-2024 359 Without new debt, -1.8% -2.4% 334 -2.1% -5.3% 0.0% -2.9% investment is 312 7.6% expected to grow 306 299 305 6.9% more than 50% by the -14.7% end of the year -2.3%…
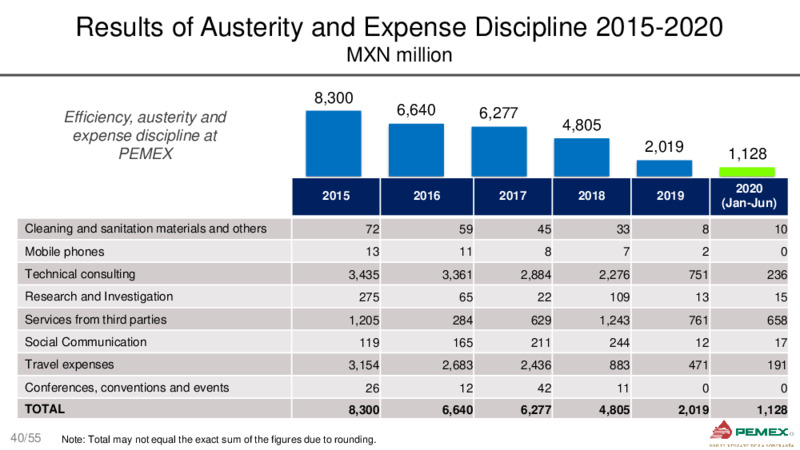
Results of Austerity and Expense Discipline 2015-2020 MXN million 8,300 Efficiency, austerity and 6,640 6,277 4,805 expense discipline at PEMEX 2,019 1,128 2020 2015 2016 2017 2018 2019 (Jan-Jun) Cleaning and sanitation…
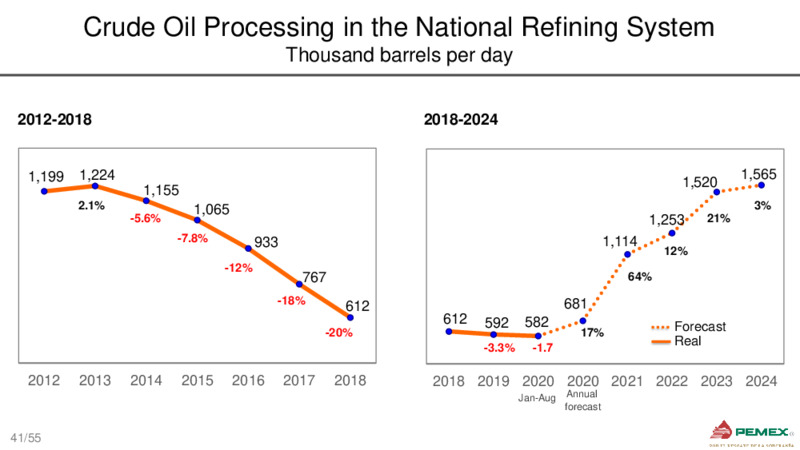
Crude Oil Processing in the National Refining System Thousand barrels per day 2012-2018 2018-2024 1,199 1,224 1,565 1,520 1,155 -1.8% -2.4% 2.1% -2.1% -5.3% -2.9% 3% 1,065 -5.6% 1,253 21% -7.8% 933 1,114 12% -12% 767…
Results of the Strategy to Combat Fuel Theft, 2018-2020 Thousand barrels per day 74 Fuel theft has decreased by 95% as compared to the average for 2018 23 5 5 5 5 5 4 3 3 4 4 6 5 4 5 4 4 3 4 5 5 5 5 5 5 6 6 6 4 6 2 3 3 3 6 6 6…
Losses due to Fuel Substraction MXN billion 36.2 Successful strategy against fuel substraction Estimated savings for PEMEX in two years amount to MXN 71.8 3.2 3.6 billion2 1.0 2.0 0.4 20181 20191 Jan-Aug 20201…
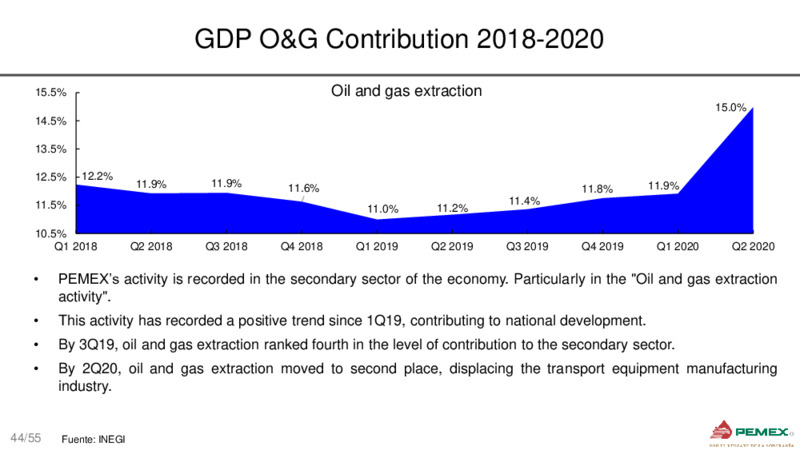
O&G Industry Contribution to National GDP, 2017-2020 710 714 4.5% Percentage share in total Growth rate : -0.25% Value of contribution to 674 594 700 671 657 656 651 4.0% 620 650 618 611 613 total GDP1 4.0% 3.9%…
Maturity Profile USD billion Before Current As of December 31, 2018 As of June 30, 2020 30.2 23.7 9.6 9.4 8.7 9.1 7.5 8.7 9.8 8.6 8.5 6.7 6.7 6.0 5.5 6.3 4.2 4.3 3.6 4.7 3.9 4.4 4.0 3.6 0.3 1.6 0.1 1 2019 2020…
Ten-year PEMEXs bond yield Pre-Covid-19 Period: Feb 2018 - Feb 2020 Covid-19 Period: Mar 2020- Jul 2020 PEMEX 10 years PEMEX 10 years 8.0 12.0 Maximum: Maximum: 7.5 20/11/18 11.0 27/04/2020 7.65% 12.05% Yield (%) (%) 7.0…
50/55
PEMEX will continue to be the most important tax contributor in 2021 According to the proposed 2021 Federal Budget, PEMEX estimates to transfer around MXN 897.2 billion to the Federal Government in the form of direct and indirect…
PEMEX contributions to the Federal Government for 2021 MXN million 897,170 Total Direct taxes (DUC1 & others) PEMEX will 352,570 continue to be the most important tax Total support from the Federal Government Indirect taxes…
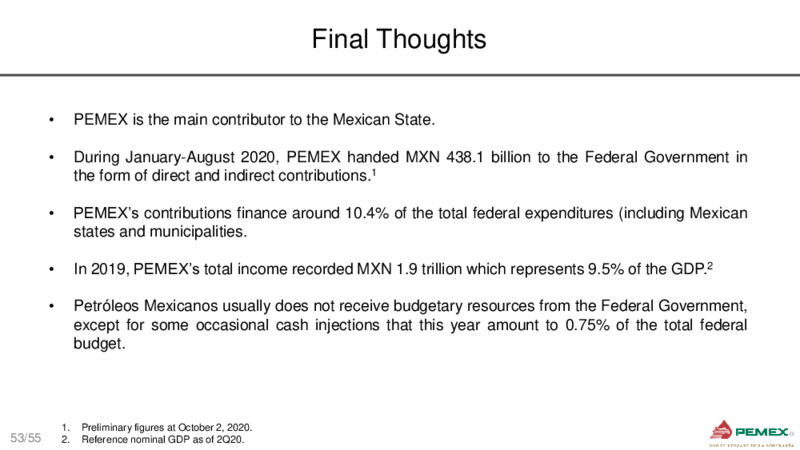
Final Thoughts PEMEX is the main contributor to the Mexican State. During January-August 2020, PEMEX handed MXN 438.1 billion to the Federal Government in the form of direct and indirect contributions.1 PEMEXs contributions…
Final Thoughts All operation expenditures for exploration, production and industrial transformation come from the companys own resources. These expenditures are not financed by the Federal Government. During 2019, for the first time…
Investor Relations (+52 55) 9126-2940 ripemex.com www.pemex.com/en/investors Sonda de Campeche
 Loading...