Q3-2020 AKER BP Uniquely positioned for value creation Continued strong operational performance Production on track Low cost and low emissions Building a leading E&P company Implementing new operating model Bond refinancing…
Q3-2020 STRONG OPERATIONAL PERFORMANCE Key performance indicators SAFETY PRODUCTION LOW HIGH LOW FIRST ON TRACK COST EFFICIENCY EMISSIONS 1.1 201.6 7.3…
Q3-2020 STRONG OPERATIONAL PERFORMANCE On track to deliver on 2020 production guidance Production Production efficiency (mboepd) Aker BP operated assets (percent) Alvheim Ivar Aasen Skarv Ula Valhall Johan Sverdrup 208.1 209.8 95.8…
Q3-2020 STRONG OPERATIONAL PERFORMANCE Industry-leading low carbon intensity Emissions intensity1) Contributing to the energy transition CO2 - kg/boe Produce efficiently to 26.5 return high value from oil & gas resources to 22.7…
Q3-2020 LEADING THE INDUSTRY TRANSFORMATION New operating model to improve efficiency and reduce cost Using the improvement toolbox to build a leading operating model 7
Q3-2020 TARGETING PROFITABLE GROWTH rfugl startup planned in Q4 with the remainder of phase II on track for 2021 Keeping the facilities full Large production increase at Skarv Low break-even project Total reserves of 300 mmboe…
Q3-2020 TARGETING PROFITABLE GROWTH Development projects well underway Hod first oil in Q1-22 Sverdrup phase 2 first oil in Q4-22 Photo: Aker BP Illustration: Equinor 9
Q3-2020 TARGETING PROFITABLE GROWTH Uniquely positioned for further organic growth Resource base provides unmatched opportunity set Tax changes reduce break-evens and capital commitments Aker BPs net reserves and resources per end-2019…
Q3-2020 TARGETING PROFITABLE GROWTH Working towards concept selection for NOAKA Lang- Krafla Askja Fulla Frigg GD Rind Fry fjellet Gas export to Statpipe Oil export Central UPP to GOP with power PDQ platform from shore…
Q3-2020 TARGETING PROFITABLE GROWTH Significant part of our resource base ready for FID by 2022 Potential to double production at low break-evens Project1) Area FID2) First oil Valhall infill drilling Frosk Valhall area Alvheim…
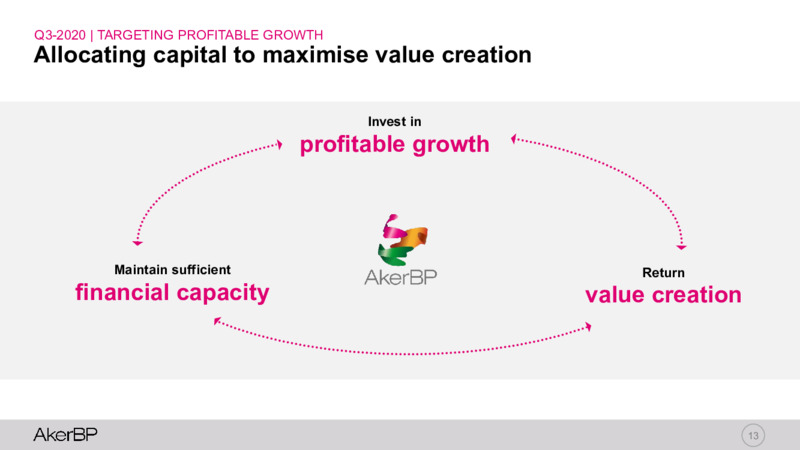
Q3-2020 TARGETING PROFITABLE GROWTH Allocating capital to maximise value creation Invest in profitable growth Maintain sufficient Return financial capacity value creation 13
Financial review 14
Q3-2020 FINANCIAL REVIEW Oil and gas sales Volume (mboepd) Realised prices (USD/boe) Total income (USDm) Other operating income Production Sales Liquids Natural gas Petroleum revenues -19% +43% +16% -4% 232.0 42.7 684 209.8…
Q3-2020 FINANCIAL REVIEW Lifted volumes and realised prices Crude oil liftings 2020-9M1) Breakdown of realised liquids prices in Q3 mmbbl USD/bbl Brent Dated Brent active contract 6.6 0.8 43.8 6.4 6.3 6.0 0.1 42.9 5.4 42.7…
Q3-2020 FINANCIAL REVIEW Income statement USD million Q3 2020 Q2 2020 Q3 2019 Total income 684 590 723 Production costs 134 196 167 Other operating expenses 7 15 6 EBITDAX 543 379 550 Exploration expenses 32 50 70 EBITDA 511 329 480…
Q3-2020 FINANCIAL REVIEW Statement of financial position USD million Assets 30.09.20 30.06.20 31.12.19 Equity and liabilities 30.09.20 30.06.20 31.12.19 Goodwill 1,647 1,647 1,713 Equity 1,929 1,912 2,368 Other provisions for…
Value creation ambition supported by strong financial position Committed long-term liquidity buffer Conservative leverage Extended debt maturity profile Available liquidity, USD billion1) Leverage ratio2) USD billion (as of 29 Oct…
Q3-2020 FINANCIAL REVIEW Expecting tax refund for fiscal year 2020 Tax payments and refunds per quarter (USD million) For fiscal year 2018 For fiscal year 2019 For fiscal year 20201) 340 208 212 163 340 106 106 208 212 81 163…
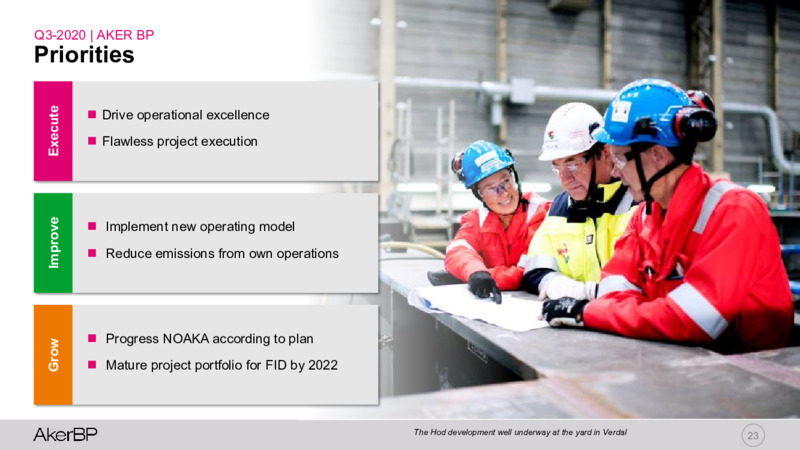
Q3-2020 AKER BP Priorities Drive operational excellence Execute Flawless project execution Improve Implement new operating model Reduce emissions from own operations Progress NOAKA according to plan Grow Mature…
 Loading...