3Q 2020 Investor Conference Presentation 1 3Q 2020 Investor Conference Presentation October 28, 2020 Andrew Lane President & CEO Kelly Youngblood Executive Vice President & CFO
3Q 2020 Investor Conference Presentation 2 Forward Looking Statements and Non-GAAP Disclaimer This presentation contains forward-looking statements within the meaning of Section 27A of the Securities Act Statement Regarding Use of…
3Q 2020 Investor Conference Presentation 3 Global Leader in PVF Distribution Gas Utilities 29% Largest pipe, valves and fittings (PVF) distributor TTM Sales of 2.7B Industrial Distributor with Diversified Business Mix…
3Q 2020 Investor Conference Presentation 4 Strategy for Creating Shareholder Value Maximize Working Optimize Capital Grow Market Share Maximize Profitability Capital Efficiency Structure Focus on higher margin Optimize…
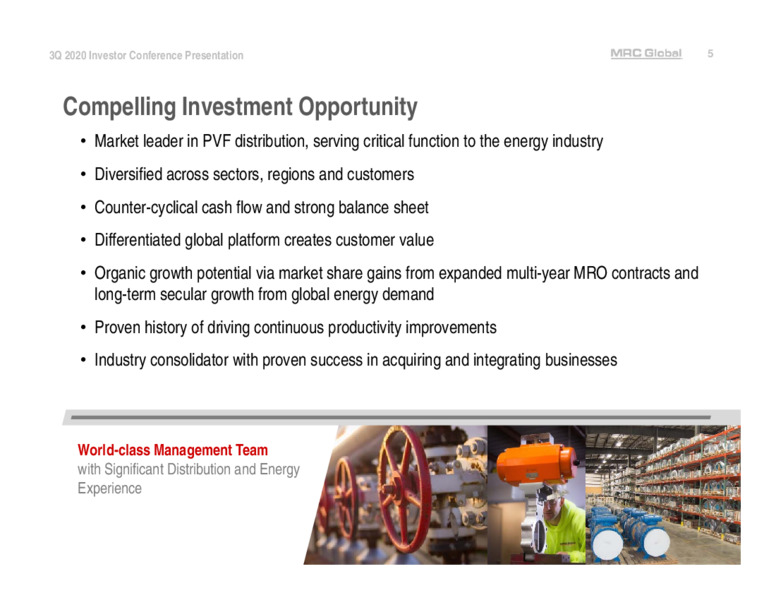
3Q 2020 Investor Conference Presentation 5 Compelling Investment Opportunity Market leader in PVF distribution, serving critical function to the energy industry Diversified across sectors, regions and customers Counter-cyclical…
3Q 2020 Investor Conference Presentation 6 Diversified by Region, Industry Sector and Product Line - Well Positioned Through Cycle Revenue by Geography Revenue by Product Line Stainless Steel, Alloy Pipe & Fittings International…
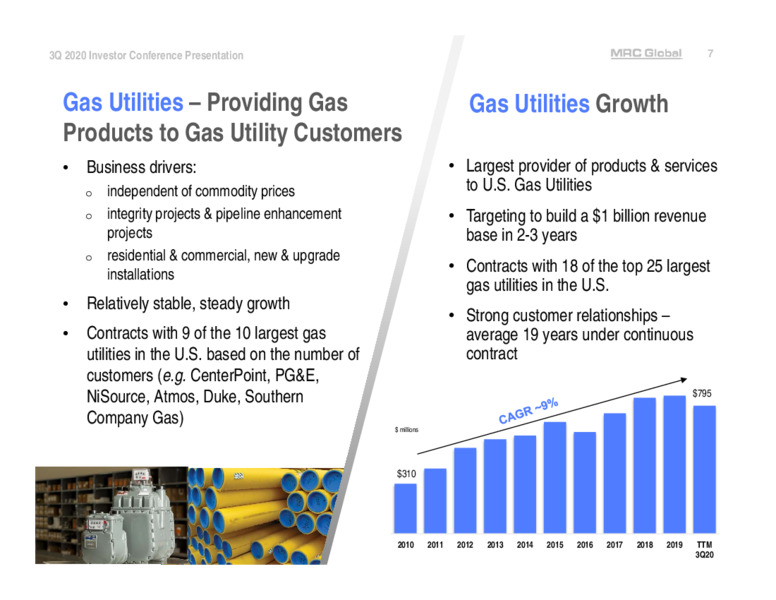
3Q 2020 Investor Conference Presentation 7 Gas Utilities Providing Gas Gas Utilities Growth Products to Gas Utility Customers Business drivers: Largest provider of products & services o independent of commodity prices to U.S. Gas…
3Q 2020 Investor Conference Presentation 8 Downstream & Industrial Providing PVF to Refining, Chemical & Industrial Customers Refining Recurring MRO revenue from planned & unplanned maintenance Provide on-location zone store…
3Q 2020 Investor Conference Presentation 9 Upstream Production Providing Completion Infrastructure to E&P Operators Provide well hook-ups via on-site product trailers, above- ground infrastructure PVF products for flow lines & tank…
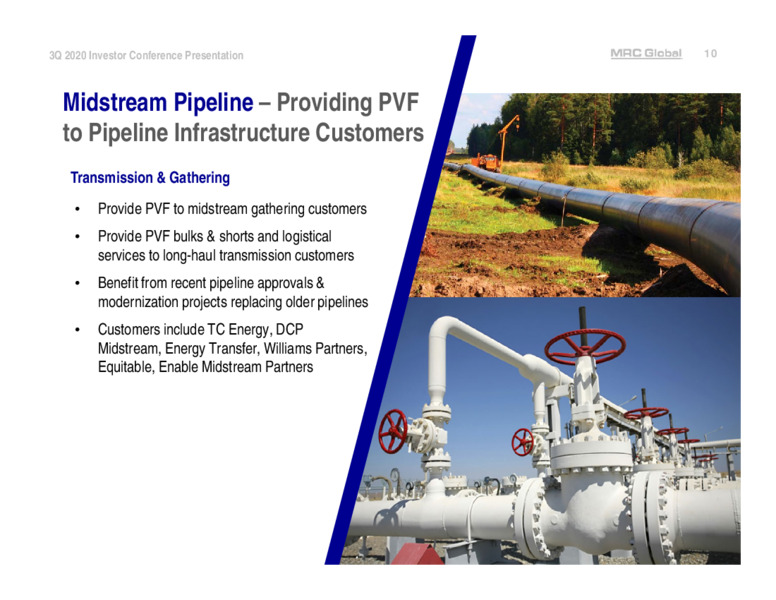
3Q 2020 Investor Conference Presentation 10 Midstream Pipeline Providing PVF to Pipeline Infrastructure Customers Transmission & Gathering Provide PVF to midstream gathering customers Provide PVF bulks & shorts and logistical…
3Q 2020 Investor Conference Presentation 11 MRC Global is a Critical Link Between Its Customers & Suppliers Energy Carbon Steel Tubulars Valves Fittings, Flanges and Other Customer Value Proposition Outsource non-core supply…
3Q 2020 Investor Conference Presentation 12 Global Footprint Strategically Located in Key Geographies to Deliver Solutions to Customers North America International Stavanger, NO Nisku, AB CANADA NORDIC Bradford, UK Munster,…
3Q 2020 Investor Conference Presentation 13 MRC Global is committed to responsible governance of the enterprise and interaction with its stakeholders. Safety Performance 2020: YTD top Quartile Safety Performance in a National…
3Q 2020 Investor Conference Presentation 14 Long-term End Market Growth Opportunities GAS UTILITIES Gas utilities are investing in multi-year infrastructure modernization programs to upgrade old, lower pressure distribution…
3Q 2020 Investor Conference Presentation 15 Strong Record of Customer Contract Wins and Renewals Yields Growth Opportunities 1. Renew Existing & Obtain New MRO Contract Selected Recent Contract Awards and Renewals Customers…
3Q 2020 Investor Conference Presentation 16 Houston Operations Complex at La Porte, TX Supporting Growth & Continued Operational Efficiencies More than 620,000 ft2 of space to deliver our customers actuation, modification and…
3Q 2020 Investor Conference Presentation 17 MRC Globals Valve-Centric Strategy U.S. oil & gas valve sales were 5.2B1 (2.6B through distribution) 2.2B Upstream & Midstream 3.0B Downstream MRC Global is 1 in U.S. distributed energy…
3Q 2020 Investor Conference Presentation 18 Market Penetration: Investment in Value-Added Valve Modification Capabilities Valve Engineering & Modification Center at La Porte complex in-house capabilities: Pipe pup transitions,…
3Q 2020 Investor Conference Presentation 20 Maximizing Profitability and Working Capital Efficiency Product Margin Investment in higher margin products and services: Portfolio Optimization Enhancement VAMI services - Valve…
3Q 2020 Investor Conference Presentation 21 Investing in Technology for Long-Term Growth & Efficiency MRCGOTM - A Comprehensive Digital Supply Chain Solution for Oil & Gas Pipe, Valve & Fitting Purchases End-to-end digital supply…
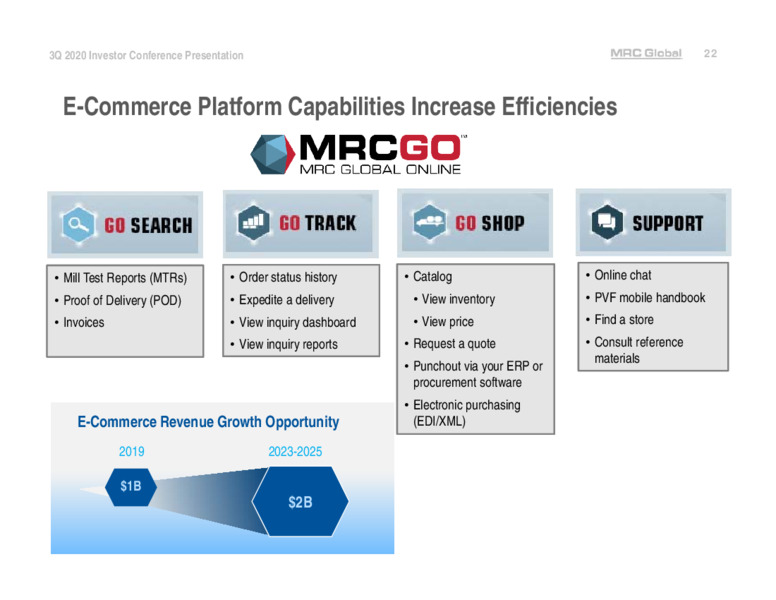
3Q 2020 Investor Conference Presentation 22 E-Commerce Platform Capabilities Increase Efficiencies Mill Test Reports (MTRs) Order status history Catalog Online chat Proof of Delivery (POD) Expedite a delivery View inventory PVF…
3Q 2020 Investor Conference Presentation 23 Strategic Capital Decisions Support Growth Effectively Positioned the Balance Sheet = Capital Deployment Opportunities Advantageous debt agreements with favorable terms, low interest Debt…
3Q 2020 Investor Conference Presentation 25 Strong Balance Sheet Provides Financial Flexibility ( millions) Total Debt Capital Structure September 30, 627 2020 Cash and Cash Equivalents 40 474 Total Debt (including current…
3Q 2020 Investor Conference Presentation 26 Capital Structure Credit Agreements (ABL and Term Loan) Financial Maintenance Covenants o Global ABL matures in September 2022 and Term o Both the ABL and Term Loan B have no financial…
3Q 2020 Investor Conference Presentation 27 Strategy - 3Q20 Accomplishments Grow Market Share Added new customer contracts and awards (e.g. downstream) Achieved 19.7% adjusted gross margins Maximize 39% of revenue from valves…
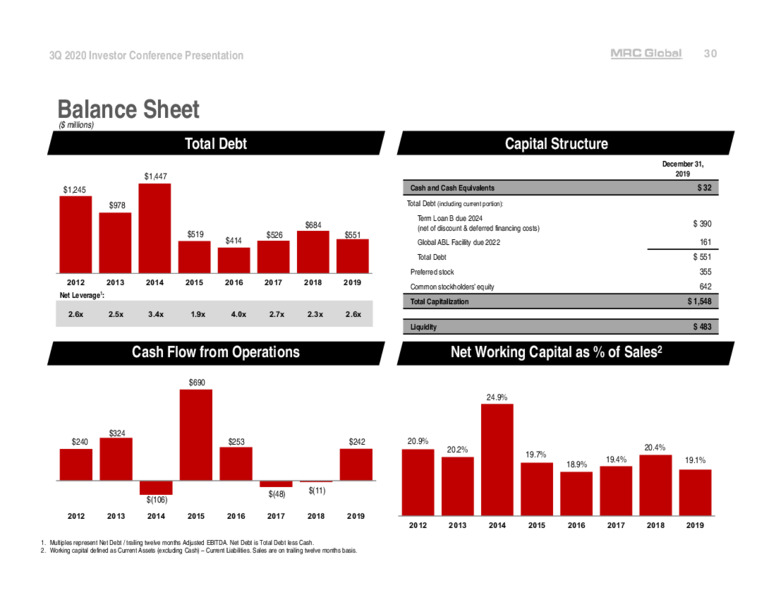
3Q 2020 Investor Conference Presentation 30 Balance Sheet ( millions) Total Debt Capital Structure December 31, 1,447 2019 1,245 Cash and Cash Equivalents 32 978 Total Debt (including current portion): Term Loan B due 2024…
3Q 2020 Investor Conference Presentation 31 Adjusted Gross Profit Reconciliation Three months ended Nine months ended Year ended December 31 ( millions) Sept 30, 2020 June 30, 2020 Sept 30, 2019 Sept 30, 2020 Sept 30, 2019 2019…
3Q 2020 Investor Conference Presentation 32 Adjusted SG&A Reconciliation Three months ended ( millions) Sept 30, 2020 Sept 30, 2019 SG&A 100 137 Severance and restructuring (5) (5) Recovery of supplier bad debt 2 -…
3Q 2020 Investor Conference Presentation 33 Adjusted EBITDA Reconciliation Three months ended Nine months ended Year ended December 31 June 30, Sept 30, ( millions) Sept 30, 2020 Sept 30, 2020 Sept 30, 2019 2019 2018 2017 2016…
3Q 2020 Investor Conference Presentation 34 Adjusted Net Income Reconciliation Three months ended Nine months ended ( millions) Sept 30, 2020 June 30, 2020 Sept 30, 2019 Sept 30, 2020 Sept 30, 2019 Amount Per Share Amount Per…
3Q 2020 Investor Conference Presentation 35 Adjusted Net Income Reconciliation Year ended December 31 ( millions) 2019 2018 2017 2016 2015 2014 2013 2012 Amount Per Share Amount Per Share Amount Per Share Amount Per Share Amount…
 Loading...