Third Quarter 2020 Conference Call November 2, 2020
MPC: Short-Term Strategic Focus 1 2 3 Strengthen Improve Competitive Position Commercial Lower Cost of our Assets Performance Structure Achieve best-in-class Leverage cost, operating, and advantaged raw Strict capital financial…
Business Update Progressing Speedway sale Growing renewables business Dickinson starting up Advancing Martinez conversion Focusing on cost reductions Positioning the company for long-term success and through-cycle resiliency…
Third Quarter Adjusted Results Adjusted Loss per Share (/share) (a) (1.00) Adjusted EBITDA (MM) (b) 1,006 Excluded from MM Adj. EBITDA & Adj. EPS Restructuring expense (348) Impairments (433) LIFO liquidation (256) LCM…
Speedway Discontinued Operations Speedway required to be reported as Refining & Discontinued Midstream Retail Discontinued Operations Marketing Operations Direct Dealer MPLX Speedway Speedway R&M segment now Other Direct…
Revised Reporting - Due to Speedway Sale Speedway Historical New Sale-Related Reporting Reporting Effects 2Q20 3Q20 2Q20 3Q20 2Q20 3Q20 Adj. EBITDA Adj. EBITDA Adj. EBITDA Adj. EBITDA Refining & Marketing (1,024) (756) 105…
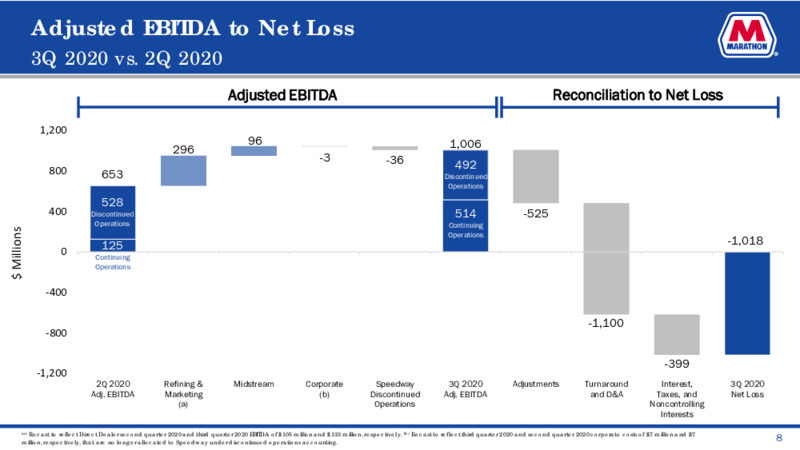
Adjusted EBITDA to Net Loss 3Q 2020 vs. 2Q 2020 Adjusted EBITDA Reconciliation to Net Loss 1,200 96 1,006 296 -3 -36 800 492 653 Discontinued Operations 528 400 Discontinued 514 -525 Operations Continuing Millions…
Refining & Marketing 3Q 2020 vs. 2Q 2020 R&M Adjusted EBITDA 0 includes Direct Dealer results (105 MM in 2Q, -200 133 MM in 3Q) 84% utilization during the Millions -400 quarter (excluding idled facilities) 73 7 -600 34…
Midstream 3Q 2020 vs. 2Q 2020 Through-cycle EBITDA 1,400 50 1,295 stability 1,199 46 1,200 Continued progress on 1,000 reducing forecasted operating expenses 800 Millions 600 Fee-based with volume protections across…
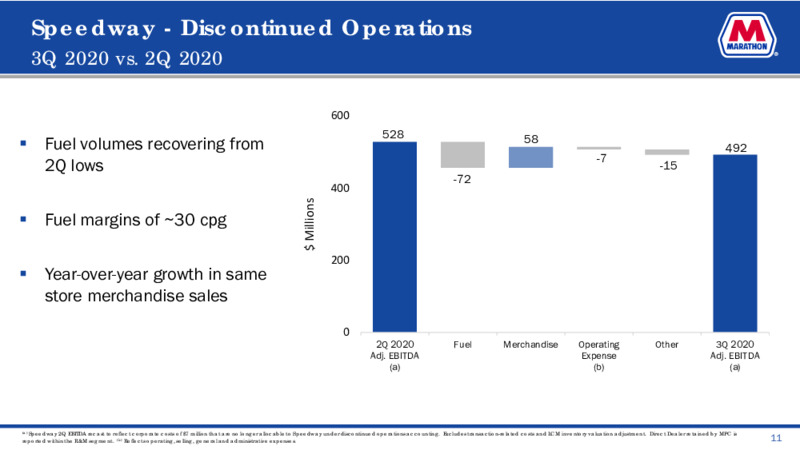
Speedway - Discontinued Operations 3Q 2020 vs. 2Q 2020 600 528 58 Fuel volumes recovering from 492 -7 2Q lows -15 -72 400 Millions Fuel margins of 30 cpg 200 Year-over-year growth in same store merchandise sales 0 2Q…
Fourth-Quarter 2020 Outlook Other Crude Total Depreciation Charge/ Sweet Sour Operating Distribution Turnaround Throughput Throughput and Feedstocks Crude Crude Cost (b) Cost (c) Costs (a) (a) Amortization Throughput (a) /BBL…
Focus on Sustainability and Corporate Leadership Environment Social Governance Recognized for Energy Committed to Independent & Diverse Efficiency with EPA Energy Diversity & Inclusion Board of Directors Star Partner Awards…
Questions & Answers Strategic Overview
Appendix 16
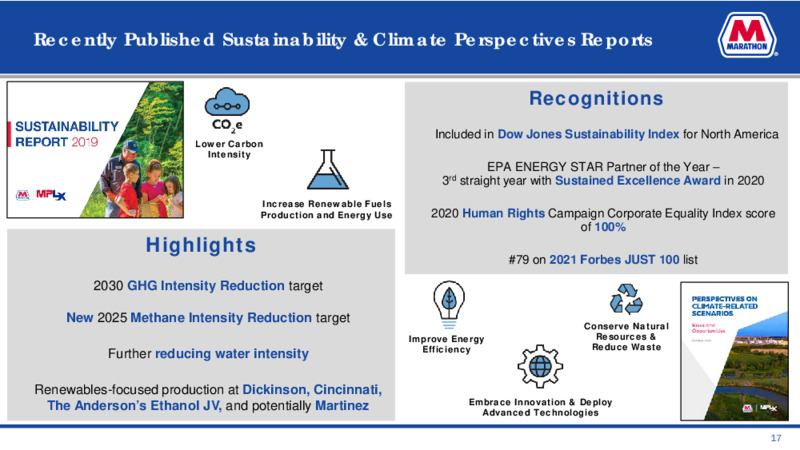
Recently Published Sustainability & Climate Perspectives Reports Recognitions Included in Dow Jones Sustainability Index for North America Lower Carbon Intensity EPA ENERGY STAR Partner of the Year 3rd straight year with Sustained…
Capitalization and Select Balance Sheet Data MPC MPLX MPC Excluding As of September 30, 2020 Consolidated Adjustments(a) MPLX (MM except ratio data) Total Debt 31,997 20,349 11,648 Total Equity(b) 30,382 10,404 19,978…
Refining & Marketing Margins Market vs. Realized Total system capture of 117%, key factors included: Direct Dealer business contributed 8% to R&M margin capture Crude timing impacts Favorable pricing of non- transportation…
Distribution Costs Components 3Q 2020 1,500 374 1,309 1,200 515 Millions 900 600 420 300 0 Third Party MPLX MPLX Fuels Distribution and 3Q 2020 Fees and Other Fees Refinery Logistics Fees Distribution Costs…
Income Summary for Operations 2019 2020 (MM unless otherwise noted) 1Q 2Q 3Q 4Q 1Q 2Q 3Q (a) Effective in the third quarter of 2020, R&M historical results have been recast and Refining & Marketing segment income (loss) (a) (303) 1,064…
Reconciliation Net Income (Loss) Attributable to MPC to Adjusted Net Income (Loss) Attributable to MPC (MM) 3Q20 3Q19 (a) Reflects the cumulative effects related Net income (loss) attributable to MPC (1,018) 1,095 to a measurement…
Reconciliation Net Income (Loss) Attributable to MPC to Adjusted EBITDA and LTM Adjusted Pro Forma EBITDA (MM) 4Q19 1Q20 2Q20 3Q20 LTM Net Income (loss) attributable to MPC 443 (9,234) 9 (1,018) (9,800) Add: Net interest and other…
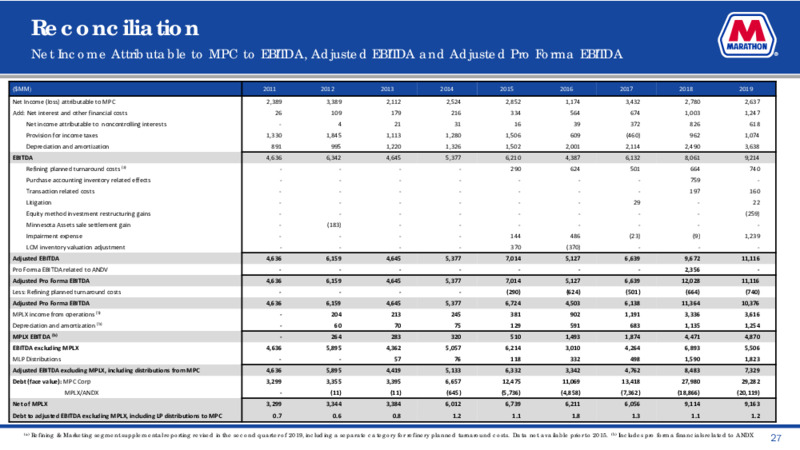
Reconciliation Net Income Attributable to MPC to EBITDA, Adjusted EBITDA and Adjusted Pro Forma EBITDA (MM) 2011 2012 2013 2014 2015 2016 2017 2018 2019 Net Income (loss) attributable to MPC 2,389 3,389 2,112 2,524 2,852 1,174 3,432…
Reconciliation MPLX Net Income (Loss) to Adjusted EBITDA Related to MPLX (MM) 4Q19 1Q20 2Q20 3Q20 LTM MPLX Net Income / (Loss) (573) (2,716) 655 674 (1,960) Add: Net interest and other financial costs 229 230 223 224 906…
Reconciliation Cash Provided by (Used in) Operations to Continuing Operating Cash Flow Before Changes in Working Capital 2020 (MM) 3Q Cash provided by (used in) operating activities from continuing operations 879 Less changes:…
Reconciliation Segment Income (Loss) from Operations to Segment Adjusted EBITDA and Adjusted EBITDA 2019 2020 (MM) 1Q 2Q 3Q 4Q 1Q 2Q 3Q Refining & Marketing Segment Effective in the third quarter of 2020, Segment income (loss) from…
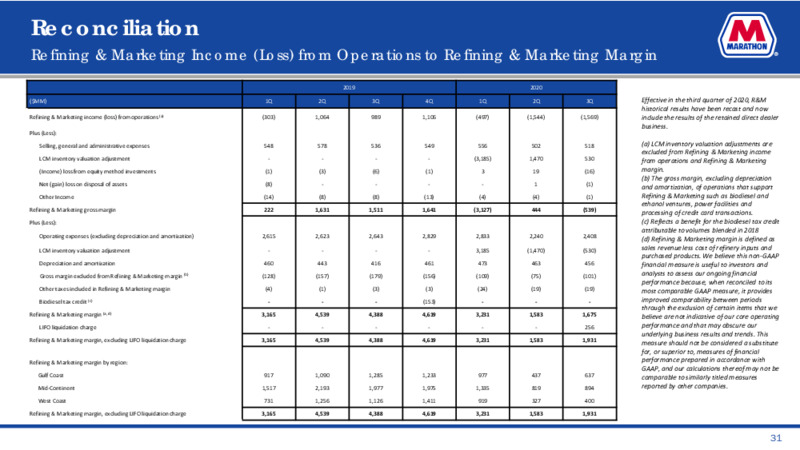
Reconciliation Refining & Marketing Income (Loss) from Operations to Refining & Marketing Margin 2019 2020 (MM) 1Q 2Q 3Q 4Q 1Q 2Q 3Q Effective in the third quarter of 2020, R&M historical results have been recast and now Refining &…
Reconciliation Income from Discontinued Operations to Speedway Total Margin 2019 2020 (MM) 1Q 2Q 3Q 4Q 1Q 2Q 3Q (a) LCM inventory valuation adjustments Income from Discontinued Operations(a) 143 344 344 283 338 406 438 are excluded…
 Loading...