USA Compression Partners, LP 2021 UBS Winter Infrastructure & Energy Virtual Conference January 12-13, 2021
USAC Overview
USAC Overview Large Horsepower Strategy Critical for Domestic Natural Gas Infrastructure Business Snapshot USAC Market Statistics USAC provides compression services across a Public since 1/2013 (NYSE: USAC) geographicallydiversified…
Q3 2020 Recap Stability Nearing Year-End Q3 2020 fleet HP of 3.7 million / average revenue generating HP of 3.0 million Q3 2020 average horsepower utilization of 84% Operational Update Quote activity picking up 11,000 large HP…
USAC Offers a Stable Infrastructure Opportunity Natural Gas Has Proven Itself as a Long-Term Fuel; Compression is Critical Bullish on natural gas production & demand, both in US and globally Supportive Macro: Gas Isnt LNG exports,…
Why Focus on Midstream Compression Operational / Cash Flow Stability with Strong Counterparties Wellhead (Gas & Oil) Midstream Downstream Uses Gas Lift Regional Gathering Interstate Pipelines Gas Reinjection Central Delivery Point…
USAC Customer Overview Top 20 Customers: Diverse Counterparties & Long-Term Relationships % of Length of % of Length of Customer Rev(1) relationship Total HP Customer Rev(1) relationship Total HP Independent Public E&P 8% 10 years…
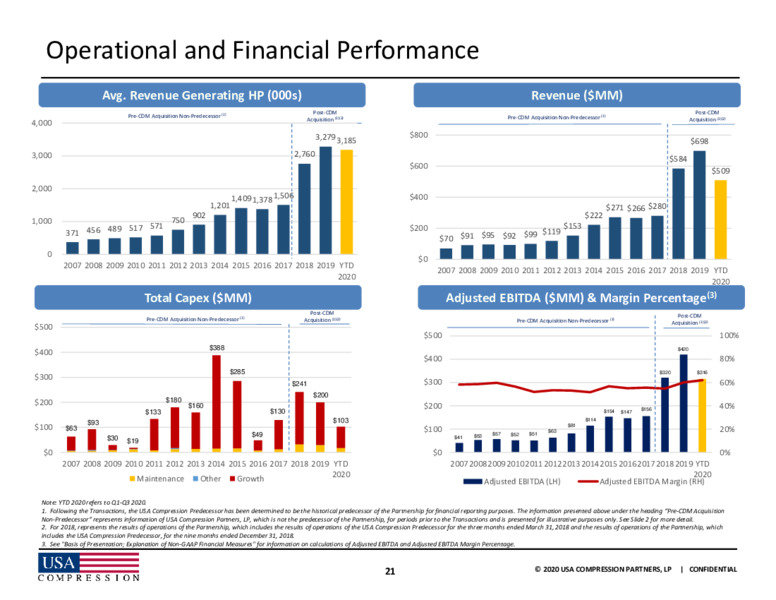
Business Model Allows for Prudent Capital Spending.. Historical Balance Between Capital Spending and Cash Flow Stability Large HP focus ideally suited for growth and stability Assets provide growth based on marketplace demands Ability…
..Leading to Cash Flow and Asset Stability Through Cycles Post-CDM Pre-CDM Acquisition Non-Predecessor (1) Acquisition (2) Horsepower HH Nat Gas Utilization /MMBTU 100.0% 14 90.0% 12 Horsepower 80.0% utilization average:…
Diversification The Right Operating Regions Dry Gas Areas Have Seen Increased Activity Lately Rockies = Northeast = 4% 24% Mid- Continent = 13% Permian/ Louisiana / Delaware Basin = East TX = 35% 7% Gulf Coast =…
Natural Gas: Not Going Away
Moderating Rig Count Should Cause Near-Term Production Decreases Slowing Rig Count / Production in Face of Resilient Demand Should Bode Well for Nat Gas After decreasing 75% off recent highs, total US rig count is up 20% from August…
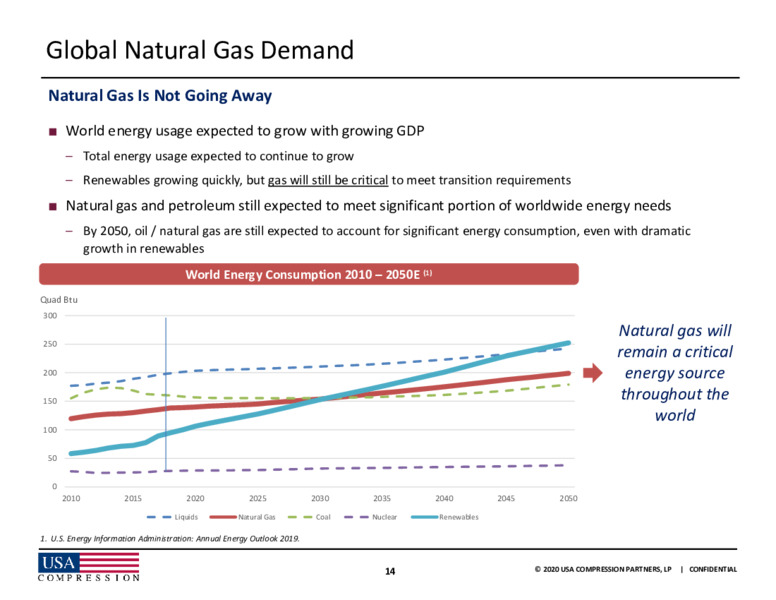
Global Natural Gas Demand Natural Gas Is Not Going Away World energy usage expected to grow with growing GDP Total energy usage expected to continue to grow Renewables growing quickly, but gas will still be critical to meet…
Domestic Natural Gas Demand Rising Baseload Natural Gas Demand Natural gas domestic consumption was up 3% in 2019 from 2018; 2020 expected to be down 1.7% (1) Longer term: Up 15% (11Bcf/d) since 2014 to 85 Bcf/d in 2019 (1) Majority…
Domestic Natural Gas Demand Growth Natural Demand Continues to Growwith Large Increases from Projected Natural Gas Demand (Bcf/d)(1) Exports to Mexico: 140 23% growth - Growing power needs to be met by US over 30 years 118 shale…
Appendix
Organizational Chart Energy Transfer Combined, the Energy Family Transfer family owns 48% of USAC Public Unitholders USA Compression GP, LLC (our general partner) 52.5% 39.3% LP LP Non-econ Preferred GP; Unitholders 8.3%…
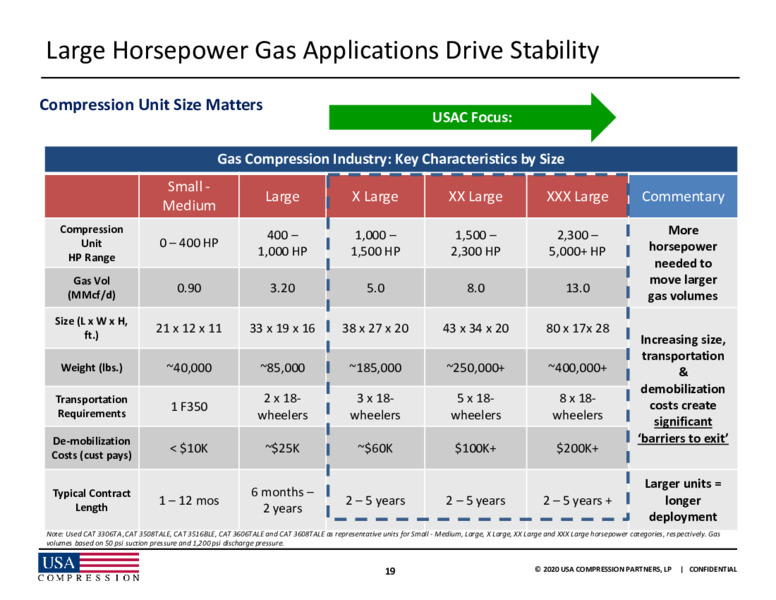
Large Horsepower Gas Applications Drive Stability Compression Unit Size Matters USAC Focus: Gas Compression Industry: Key Characteristics by Size Small - Large X Large XX Large XXX Large Commentary Medium Compression 400 1,000…
Balancing Distribution Stability and Leverage Annualized Distributions per Common Unit Stability in Distribution through the cycle Pre-CDM Acquisition Post-CDM 2.50 Non-Predecessor (1)(2) Acquisition (2)(4) 2.10 2.10 2.10 2.10…
Macro Thesis: The Shift to Shale Shale Gas Expected to be the Primary Source in Future Shale Ramp: Production from shale has now pulled Shale gas is typically produced at lower wellhead even with all other sources pressures (0-50…
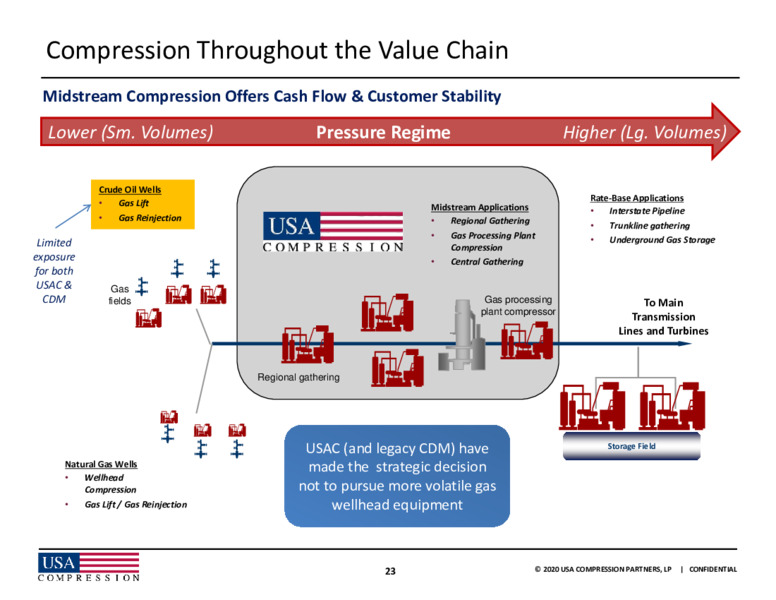
Compression Throughout the Value Chain Midstream Compression Offers Cash Flow & Customer Stability Lower (Sm. Volumes) Pressure Regime Higher (Lg. Volumes) Crude Oil Wells Rate-Base Applications Gas Lift Midstream Applications…
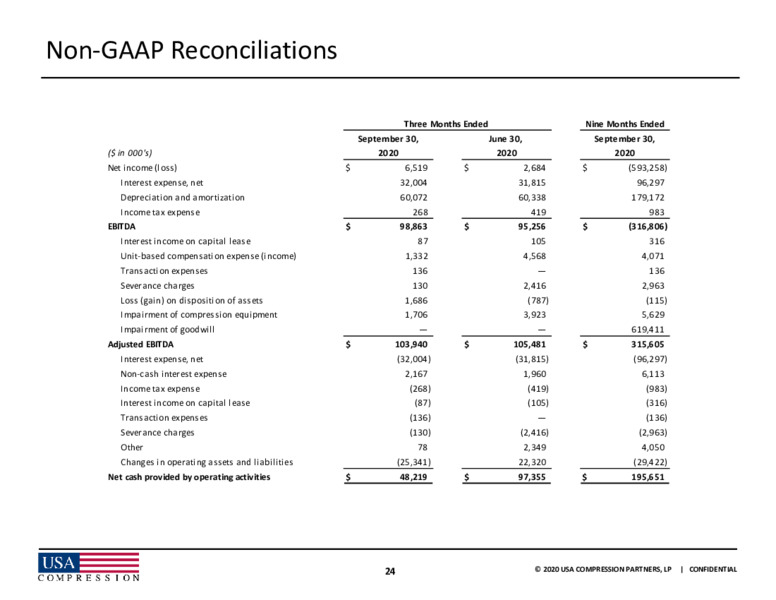
Non-GAAP Reconciliations Three Months Ended Nine Months Ended September 30, June 30, September 30, ( in 000's) 2020 2020 2020 Net income (loss) 6,519 2,684 (593,258) Interest expense, net 32,004 31,815 96,297 Depreciation and…
Non-GAAP Reconciliations, contd. Years Ended December 31, ( in 000's) 2019 2018 2017 2016 2015 2014 2013 2012 2011 2010 2009 2008 2007 Net income (loss) 39,132 (10,551) 11,440 12,935 (154,273) 24,946 11,071 4,503 69 10,479 21,228…
Non-GAAP Reconciliations, contd. Three Months Ended Nine Months Ended September 30, June 30, September 30, ( in 000's) 2020 2020 2020 Net income (loss) 6,519 2,684 (593,258) Non-cash interest expense 2,167 1,960 6,113 Depreciation…
Non-GAAP Reconciliations, contd. 2020 Guidance Guidance Net loss (600.0 million) to (590.0 million) Plus: Interest expense, net 128.0 million Plus: Depreciation and amortization 240.0 million Plus: Income tax expense 1.0 million…
 Loading...