Forward Looking Statements & Non-GAAP Financial Measures This presentation includes forward-looking statements for purposes of the safe harbor provisions of the Private Securities Litigation Reform Act of 1995, Section 27A of the…
Creating Value for Shareholders High quality, contiguous acreage position located in the core of the Utica and SCOOP High Quality Natural Gas Assets Cost structure materially improved with right-sized firm transportation portfolio…
Gulfport Energy Overview Key Highlights NYSE: GPOR Utica 193,000 Net Acres Market Cap(1): 1.7 Billion 3Q2021 Net Production: 700 MMcfe/d Enterprise Value(2): 2.5 Billion YE20 Proved Reserves: 1.7 Net Tcfe Liquidity(3): 388 Million…
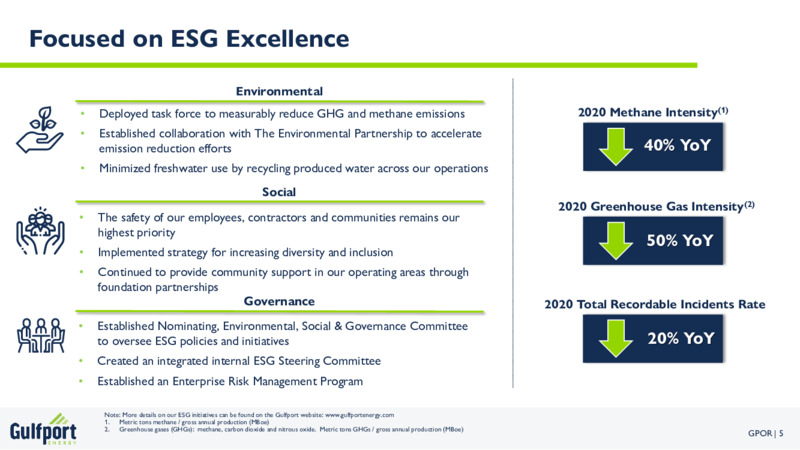
Focused on ESG Excellence Environmental Deployed task force to measurably reduce GHG and methane emissions 2020 Methane Intensity(1) Established collaboration with The Environmental Partnership to accelerate emission reduction efforts…
Delivered Strong Third Quarter Results Total Incurred Per Unit Free Current Leverage Net Production Capital Expenditures Operating Cost(3) Cash Flow(1,3) (Net Debt(4) to EBITDA(3)) 3Q 2021 973 MMcfepd 81 Million 1.22 per Mcfe…
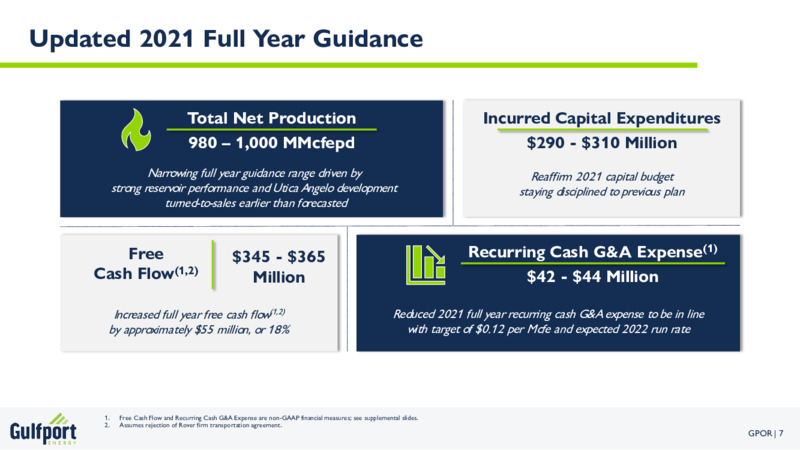
Updated 2021 Full Year Guidance Total Net Production Incurred Capital Expenditures 980 1,000 MMcfepd 290 - 310 Million Narrowing full year guidance range driven by Reaffirm 2021 capital budget strong reservoir performance and Utica…
2021E Capital Program and Outlook Capital Program Production Prioritizing free cash flow(1) generation with capital discipline focused Executing maintenance level program on high-return projects Narrowing production guidance range to…
Sustainable Free Cash Flow Generation Gulfports go-forward 2022E Free Cash Flow(1,2,3) development plan targeting: 500 Total Net 1.0 Bcfepd 400 Production 300 Capital Millions 300 Million Expenditures 200 At 3.50 gas…
Utica 2021 Development Plan Key Highlights Utica net production totaled 700 MMcfepd during 3Q2021(1) 2021 turn-in-line program concluded with 17 gross wells Angelo Pad Shannon, Hendershot, Morris and Gehrig Pads all outperforming…
Angelo Pad Development Fracture Stimulation Industry leading Ohio Utica development with simul-frac technology Achieved 9.1 stages per day on average compared to 6.5 stages per day in 2020, with individual days as high as 16 stages…
Angelo Pad Development Drill-Out Operations Drill out with dual standalone snubbing units Achieved 5,075 feet/day per snubbing unit Dual rig drill-out accelerated production by 10 days Angelo pad average lateral length of 17,026 and…
Angelo Pad Development Flowback & Production Angelo pad brought online mid-October and flowing above the combined gross target rate of 235 MMcfepd Currently flowing at a peak 250 MMcfepd Operating control center provides 24/7…
Angelo Pad Development Utica Total Well Cost Per Foot(1) Key Highlights 1,248 Identified opportunities to further reduce costs / Foot of Lateral 1,102 897 Dual fuel utilization for drilling rig and frac spreads 750 Top hole…
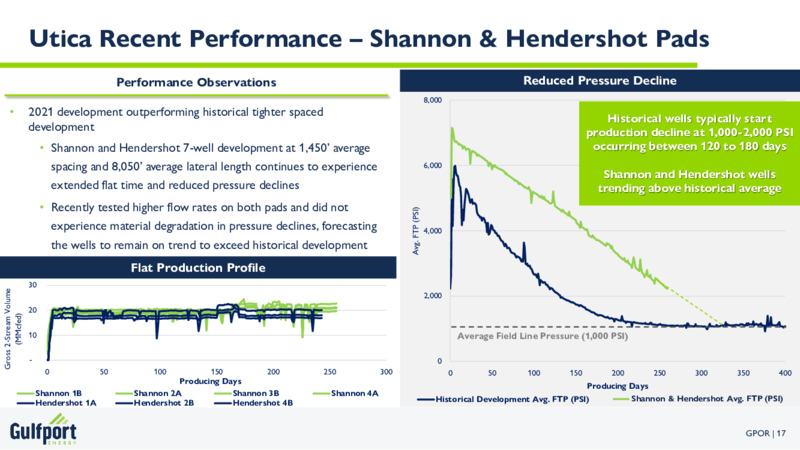
Utica Recent Performance Shannon & Hendershot Pads Performance Observations Reduced Pressure Decline 8,000 2021 development outperforming historical tighter spaced Historical wells typically start development production decline at…
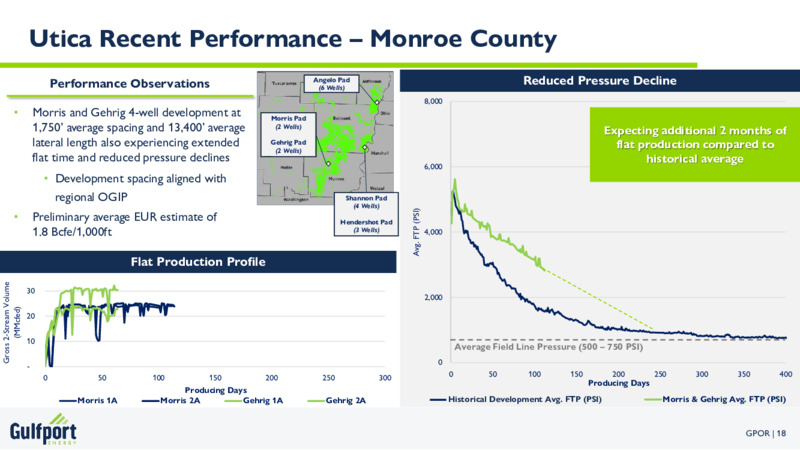
Utica Recent Performance Monroe County Performance Observations Angelo Pad (6 Wells) Reduced Pressure Decline 8,000 Morris and Gehrig 4-well development at Morris Pad 1,750 average spacing and 13,400 average (2 Wells) Expecting…
SCOOP 2021 Development Plan & Recent Performance Performance Observations Frick Pad (3 Wells) SCOOP net production totaled 275 MMcfepd during 3Q2021(1) Angela Pad 69% natural gas, 22% NGL and 9% oil(1) (3 Wells) 2021 turn-in-line…
Substantial Improvement in Cost Structure Total Cost Per Unit (/Mcfe) Targeting best in class cost metrics with additional opportunities identified Total 1.88 Annual interest expense reduced by nearly Total 90 million 1.44…
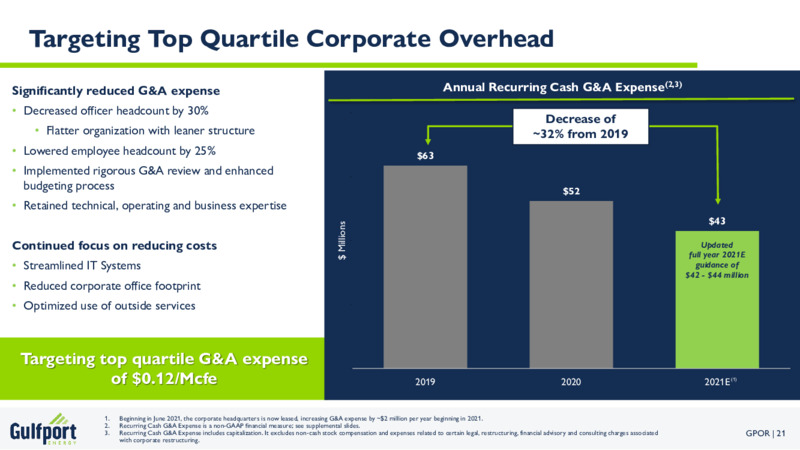
Targeting Top Quartile Corporate Overhead Significantly reduced G&A expense Annual Recurring Cash G&A Expense(2,3) Decreased officer headcount by 30% Decrease of 80 Flatter organization with leaner structure 32% from 2019…
Financial Update
Compelling Value for Shareholders Best-in-Class EBITDA Margins Lowest EV / EBITDA Multiple 2021E Adjusted EBITDA / Mcfe(1,3,4) EV / 2021E Adjusted EBITDA(1,3,4,5) 1.94 1.91 7.8x 1.52 1.42 1.40 5.3x 5.5x 1.27 4.8x 5.0x 3.6x GPOR…
Credit Facility Amendment Overview Elected Commitments 700 million Credit Facility(1) Borrowing Base 850 million Redeterminations Semi-annual, beginning May 1, 2022 Increase in Significant increase elected commitments in liquidity…
Capital Structure and Financial Profile Third Quarter 2021 Overview As of September 30, 2021(2) 4 million of cash equivalents 700 700 Cash and Liquidity 388 million of liquidity(1,2) No Significant 600 Maturities 550 200 million…
Appendix
Updated 2021E Guidance FY 2021E FY 2021E Guidance Guidance Production PREVIOUS UPDATED Incurred Capital Expenditures PREVIOUS UPDATED D&C - millions 270 290 270 290 Average Net Daily Gas Equivalent MMcfe/d 975 1,000 980 1,000…
2021E Development Plan Overview 2021E Development Plan(2) Average Lateral Length(1) Capital Expenditures 195 Million(3) 15,000' 12,550 Well Count Lateral Length 11,350' 9,750' Utica Spuds 21 Gross (20.0 Net) 15,100' 7,700' 8,000'…
Advantaged Firm Portfolio Provides Access to Diverse Markets Right-sized and diversified takeaway capacity 725 MDth/d(1,2) of firm takeaway from the Utica 175 MDth/d(1) of firm takeaway from the SCOOP Upstream connectivity provides…
Hedged Production Hedge Book(1) Natural Gas Oil Propane Swaps Collars Calls Sold Swaps Collars Swaps Volume Avg. Price Volume Avg. Put Avg. Call Volume Avg. Call Volume Avg. Price Volume Avg. Put Avg. Call Volume Avg. Price MMBtu/d…
Adjusted EBITDA Adjusted EBITDA is a non-GAAP financial measure equal to net (loss) income, the most directly comparable GAAP financial measure, plus interest expense, income tax expense, depreciation, depletion and amortization and…
Free Cash Flow Free Cash Flow is a non-GAAP measure defined as adjusted EBITDA plus certain non-cash items that are included in net cash provided by (used in) operating activities but excluded from adjusted EBITDA less interest expense,…
Recurring General and Administrative (G&A) Expense Recurring General and Administrative Expense is a non-GAAP financial measure equal to general and administrative expense (GAAP) plus capitalized general and administrative expense, less…
 Loading...