Fourth quarter 2021 conference call February 15, 2022 1
Franois Poirier President and Chief Executive Officer FEBRUARY 15, 2022
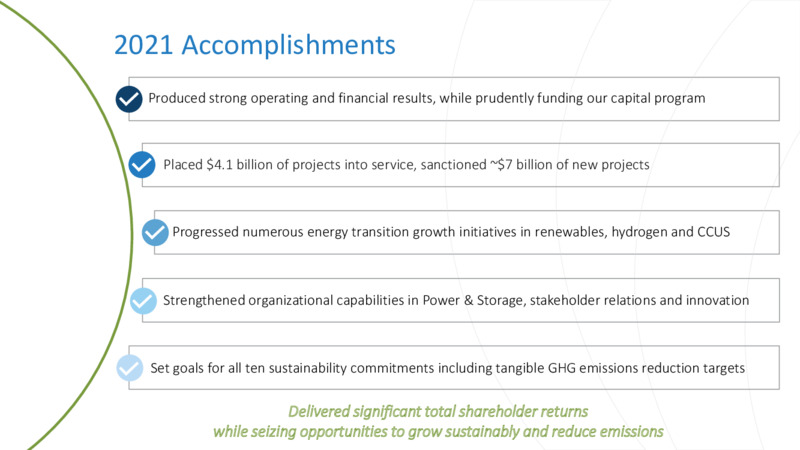
2021 Accomplishments Produced strong operating and financial results, while prudently funding our capital program Placed 4.1 billion of projects into service, sanctioned 7 billion of new projects Progressed numerous energy…
Strong operating performance Highlights Canadian Natural Gas Pipelines NGTL 2021 average export flows reached decade level highs Set an all-time high on intra-basin delivery of 8.1 Bcf/d on January 5, 2022 U.S. Natural Gas…
Financial highlights(1) year ended December 31 Comparable earnings Comparable EBITDA(2) Comparable funds generated from operations(2) per common share(2) (dollars) (millions of dollars) (millions of dollars) Performance…
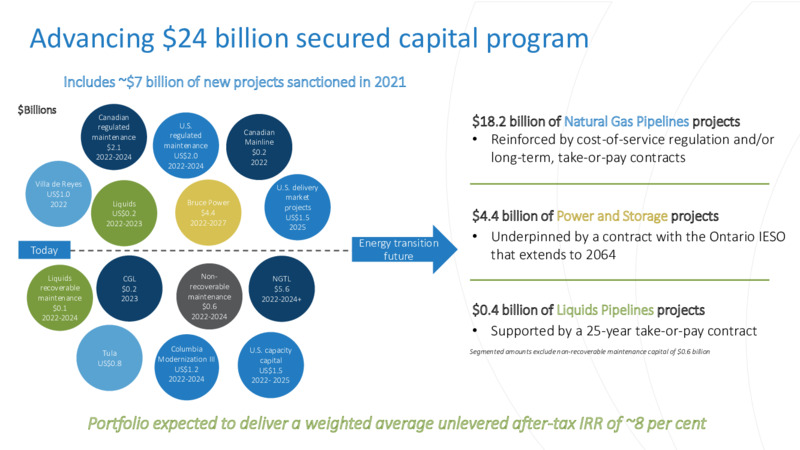
Advancing 24 billion secured capital program Includes 7 billion of new projects sanctioned in 2021 Billions Canadian regulated U.S. 18.2 billion of Natural Gas Pipelines projects Canadian maintenance 2.1 regulated maintenance…
Substantial suite of opportunities to extend our growth horizon Billions Electrification of our pipeline network Using renewables to power a portion of our pipeline network Incremental investments Other in-corridor growth…
We are confident in our ability to grow Billions Additional growth opportunities and enhancements Comparable EBITDA(1) Outlook 5% CAGR We have a sustainable competitive advantage (1) Comparable EBITDA is a non-GAAP…
Common share dividend increased 3.4 per cent 3.60(1) Declared a first quarter 2022 dividend of 0.90 per share Equivalent to 3.60 per share annually Twenty-two consecutive years of common share dividend increases with 3-5%…
2022 Priorities Safely deliver the energy people need, every day Increase return on capital invested in existing assets Place 6.5 billion of assets in service Sanction 5+ billion of high-quality growth opportunities Maintain…
Joel Hunter Executive Vice-President and Chief Financial Officer FEBRUARY 15, 2022
Consolidated results of operations Three months Year ended (millions of dollars, except per share amounts) ended December 31 December 31 2021 2020 2021 2020 Net income attributable to common shares 1,118 1,124 1,815 4,457 Specific…
Business segment results(1) (millions of dollars) Three months Year ended ended December 31 December 31 2021 2020 2021 2020 Comparable EBITDA(2) Canadian Natural Gas Pipelines 674 682 2,675 2,566 U.S. Natural Gas Pipelines 1,032…
Other income statement items(1) Three months Year ended (millions of dollars) ended December 31 December 31 2021 2020 2021 2020 Comparable EBITDA(2) 2,404 2,323 9,382 9,351 Depreciation and amortization (634) (652) (2,522) (2,590)…
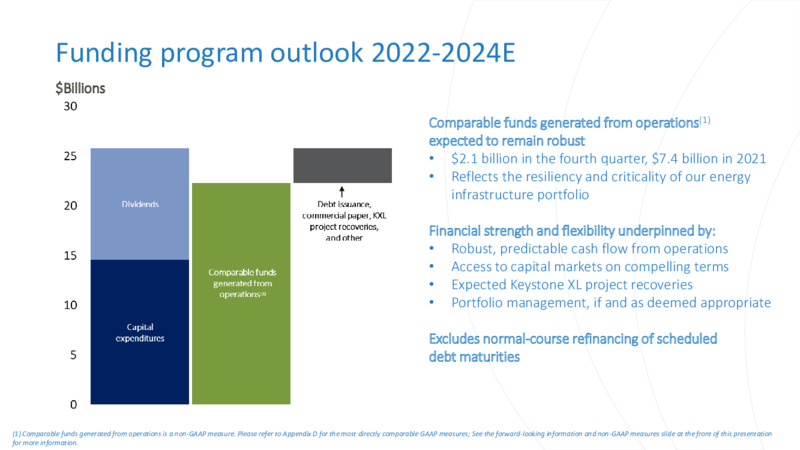
Funding program outlook 2022-2024E Billions Comparable funds generated from operations(1) expected to remain robust 2.1 billion in the fourth quarter, 7.4 billion in 2021 Reflects the resiliency and criticality of our energy…
2022 Outlook Comparable EBITDA(1) Canadian Natural Higher driven by continued NGTL System expansion and recovery of flow-through items, partially offset by the reduction Gas Pipelines of flow-through depreciation in the Canadian…
Comparable EBITDA(1) outlook 2021-2026E Billions Additional growth opportunities and enhancements Reflects current portfolio of high-quality, long-life assets and secured projects expected to enter service by 2026 5% CAGR 95%…
Delivering long-term shareholder value Track record Visible growth 13% average annual total shareholder 24 billion secured capital program through 2027 return since 2000 Vast opportunity set emanating from irreplaceable footprint and…
Question & answer period
Fourth quarter 2021 conference call February 15, 2022 21
Appendix A Financial highlights comparable GAAP measures Year ended December 31, 2021 Net Income per Common Share Segmented Earnings Net Cash Provided by Operations (dollars) (millions of dollars) (millions of dollars)
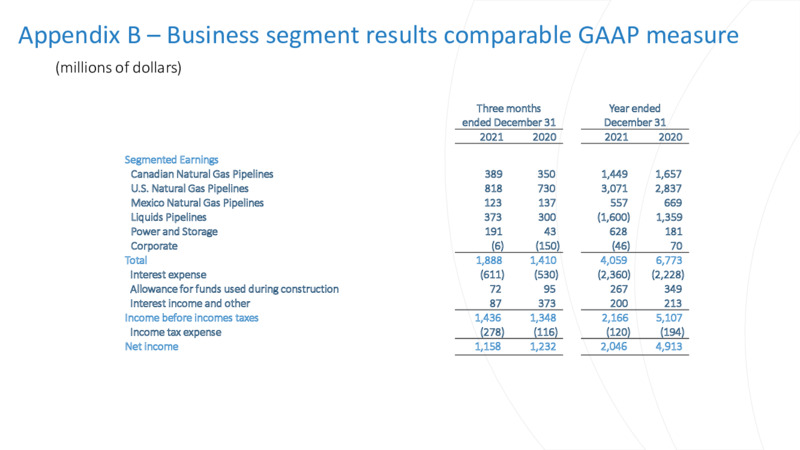
Appendix B Business segment results comparable GAAP measure (millions of dollars) Three months Year ended ended December 31 December 31 2021 2020 2021 2020 Segmented Earnings Canadian Natural Gas Pipelines 389 350 1,449 1,657 U.S.…
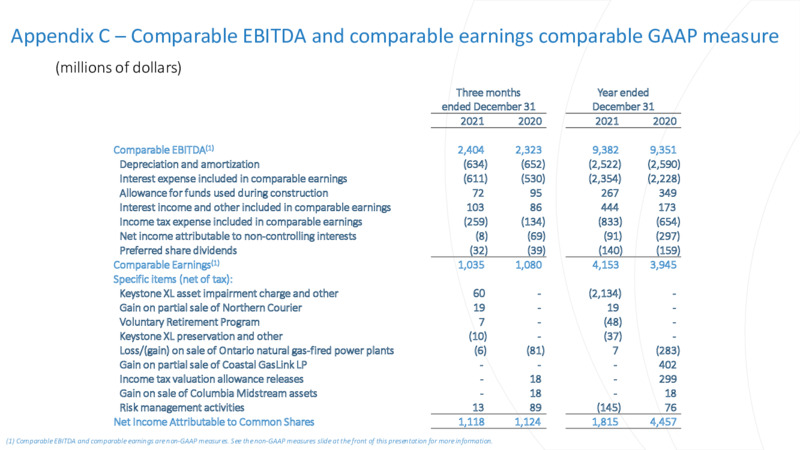
Appendix C Comparable EBITDA and comparable earnings comparable GAAP measure (millions of dollars) Three months Year ended ended December 31 December 31 2021 2020 2021 2020 Comparable EBITDA(1) 2,404 2,323 9,382 9,351 Depreciation…
Appendix D Funds generated from operations and comparable funds generated from operations comparable GAAP measure (millions of dollars) Three months Year ended ended December 31 December 31 2021 2020 2021 2020 Net Cash Provided…
 Loading...