F O R W A R D - L O O K I N G S TAT E M E N T S T h i s p r e s e n t a t i o n c o n t a i n s f o r wa r d - l o o k i n g s t a t e m e n t s a n d i n f o r m a t i o n . T h e s e f o r wa r d - l o o k i n g s t a t e m e n t s ,…
NON-GAAP MEASURES D i s t r i b u t a b l e C a s h F l o w, A d j u s t e d E B I T D A , a n d N e t O p e r a t i n g M a r g i n a r e n o t m e a s u r e s o f p e r f o r m a n c e c a l c u l a t e d i n a c c o r d a n c e w i t h…
K E Y I N V E S T M E N T C O N S I D E R AT I O N S HIGH-QUALITY S U B S TA N T I A L PROVEN GROWTH STRONG DIVERSIFIED GROWTH &CUSTOMER FINANCIAL ASSETS OPPORTUNITIES S AT I S FA C T I O N PROFILE Leading presence in 2014 growth…
W H E R E W E O P E R AT E Utica Developing a leading position in the southern core of the Utica Shale with 585 MMcf/d of processing capacity and 24,000 Bbl/d C3+ fractionation capacity. Growing to over 1.1 Bcf/d of processing…
SOUTHWEST SEGMENT Processing In the Southwest segment, we provide best-in-class 1.1Bcf/d midstream services including gathering and processing in many resource plays throughout Fractionation Oklahoma and Texas. In addition, we process…
MARCELLUS & UTICA: DRIVING U.S. GAS GROWTH Wellhead gas production (before flaring and NGL extraction) Rest of U.S. Marcellus & Utica 65 17 64 16 Billion cubic feet per day (Bcf/d) Billion cubic feet per day (Bcf/d) 63 15…
MARCELLUS SEGMENT We are the largest processor and fractionator in the liquids-rich Processing areas of the Marcellus Shale and provide fully-integrated natural gas midstream services 2.2Bcf/d Fractionation 172,000Bbl/d Gathering…
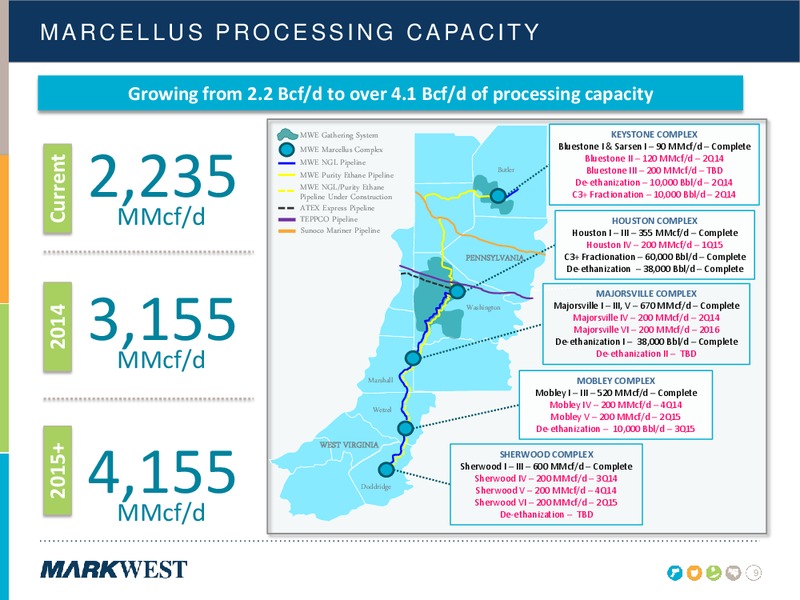
M A R C E L L U S P R O C E S S I N G C A PA C I T Y Growing from 2.2 Bcf/d to over 4.1 Bcf/d of processing capacity MWE Gathering System KEYSTONE COMPLEX MWE Marcellus Complex Bluestone I & Sarsen I 90 MMcf/d Complete 2,235…
MARCELLUS SEGMENT OVERVIEW 17% Increase Five complexes in the Marcellus Shale with 600 in Utilization from 4Q13 over 2.2 Bcf/d of total processing capacity 500 Processing capacity utilization increased 17% from the fourth quarter…
UTICA SEGMENT In the Utica segment, we are partnered with The Energy & Minerals Processing Group, and have a leading position in developing fully-integrated gathering, processing, fractionation, and NGL marketing solutions 585MMcf/d…
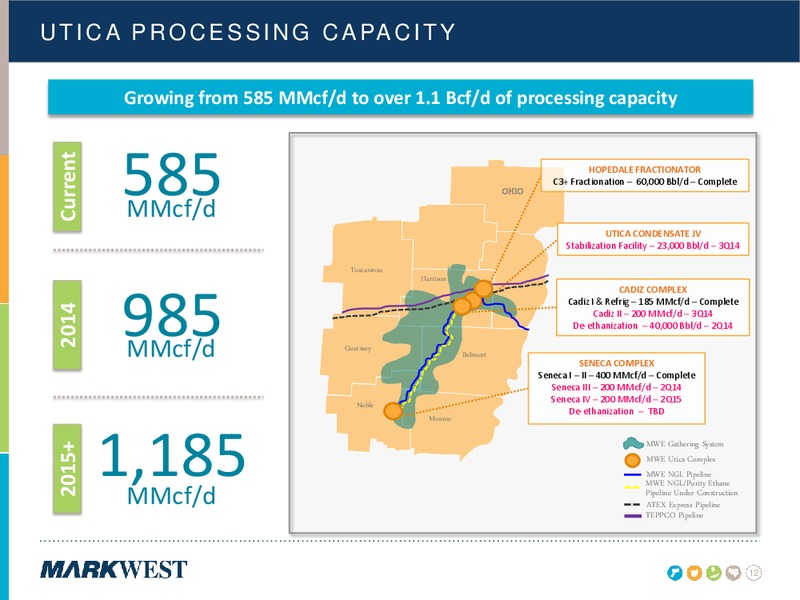
U T I C A P R O C E S S I N G C A PA C I T Y Growing from 585 MMcf/d to over 1.1 Bcf/d of processing capacity 585 Current HOPEDALE FRACTIONATOR C3+ Fractionation 60,000 Bbl/d Complete OHIO MMcf/d UTICA CONDENSATE JV…
H O P E D A L E F R A C T I O N AT I O N C O M P L E X MarkWests third large-scale fractionation and marketing complex in Northeast Fractionation 60,000 Bbl/d Propane and heavier purity products NGL Pipeline Connecting Hopedale…
M A R C E L L U S & U T I C A F R A C T I O N AT I O N O V E R V I E W Total C2+ NGLs fractionated have increased over 125% from last quarter and over 245% from the first quarter 2013 Average utilization of MarkWests C3+…
M A R C E L Lake LU Erie S & U T I C A : F U L L - S E R V I C E C A PA B I L I T I E S MWE Marcellus Complex MWE Utica Complex MWE Gathering System KEYSTONE Rich-Gas Area OHIO ATEX Express Pipeline TEPPCO Product Pipeline…
G R O W T H D R I V E N B Y C U S T O M E R S AT I S FA C T I O N MarkWest has received the top rating in three of the last four EnergyPoint Research surveys 116 6
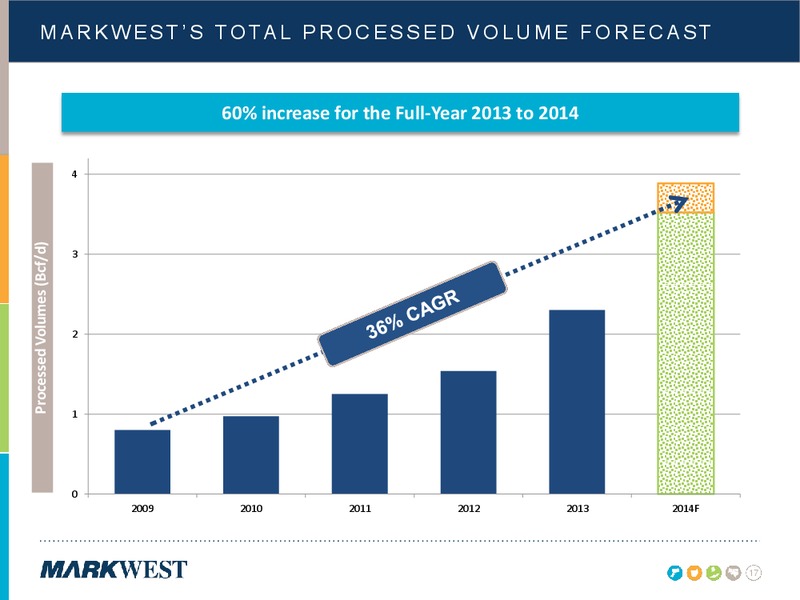
M A R K W E S T S T O TA L P R O C E S S E D V O L U M E F O R E C A S T 60% increase for the Full-Year 2013 to 2014 4 Processed Volumes (Bcf/d) 3 2 1 0 2009 2010 2011 2012 2013 2014F 1 7 17
2014 DCF FORECAST 2014 DCF Forecast of 600 to 690 million and year-over-year distribution growth of 7% in 2015 and 10% in 2016 800 Over 30% Distributable Cash Flow ( in millions) 600 Growth in DCF from FY2013 to mid-point…
INCREASING FEE-BASED INCOME 2014 fee-based net operating margin is forecasted to exceed 70% 75% Over 70% Net Operating Margin (%) Increase of 50% 3x since 2008 61% 53% 25% 39% 38% 38% 25% 0% 2008YE…
2014 CAPITAL INVESTMENT FORECAST 2014 Capital Investment Forecast of 2.0 to 2.3 billion Marcellus Growth Capex Growth Capex as % of PP&E 69% 2,500 35% 30% 2,000 25% 1,500 20% 15% 1,000 10% Utica 500 5% 24%…
M A R K W E S T I N V E S T M E N T C O N S I D E R AT I O N S : W H AT TO EXPECT Maintain strong customer base in key resource plays with high-quality assets and exceptional service Continue to execute on growth projects that are…
APPENDIX
R E C O N C I L I AT I O N O F D C F & D I S T R I B U T I O N C O V E R A G E Year Ended Three Months Ended ( in millions) 12/31/2013 3/31/2014 Net Income 40.4 15.9 Depreciation, amortization, impairment, and other non-cash…
R E C O N C I L I AT I O N O F A D J U S T E D E B I T D A Year Ended Year Ended LTM Ended ( in millions) 12/31/2012 12/31/2013 3/31/2014 Net income 217.0 40.4 77.5 Non-cash compensation expense 8.2 7.8 9.4 Non-cash derivative…
R E C O N C I L I AT I O N O F N E T O P E R AT I N G M A R G I N Year Ended Three Months Ended ( in millions) 12/31/2013 3/31/2014 Income from operations 245.9 72.0 Facility expense 291.1 83.7 Derivative activity 25.8 (4.1)…
1515 Arapahoe Street Tower 1, Suite 1600 Denver, Colorado 80202 PHONE: 303-925-9200 I N V E S T O R R E L AT I O N S : 866-858-0482 E M AI L : investorrelationsmarkwest.com W EBSITE: www.markwest.com
 Loading...